


The Parabolic Short
Bracco (@braczyy on X) - June 13th , 2025

Disclaimer: This is not financial advice; it’s purely an educational post based on my studies and insights from respected traders. There are various types of mean reversion trades, but today I’m focusing on my 5-star Parabolic Short setup and how to trade it effectively. While this setup is more common in small caps, I prefer mid-to-large cap stocks. I’ve observed different approaches to Parabolic Shorts from talented traders, varying in entries, identification methods, and more. No perfect strategy exists—it’s about personal preference. Get creative, make contact, study, and review.
Parabolic Shorts can be complex, but I’ll break down key terms to keep it approachable, so don’t let the complexity discourage you from learning. If you’re new to trading or unfamiliar with Parabolic Shorts, avoid jumping in just because you see me or others discussing them. This setup is one of the toughest to execute, and here’s why:
Timing is everything, especially if you’re trading directionally like I do. I’ve spent countless hours studying this setup, and have developed a knack for timing them—most of the time to the exact day. If you go back and look at the best Parabolic Shorts, they follow a very predictable pattern. It’s human emotions and behavior playing out on a chart, repeating over and over, just different tickers and different players. But getting the timing wrong can be brutal. Being too early to a Parabolic Short is a recipe for disaster. You might think, “This can’t keep going up forever, it has to come down eventually”. Then emotions take over, you spiral out of control, and continue to average down on a losing position until you’ve got nothing left. When dealing with this setup, the classic market adage comes to mind “The market can remain irrational longer than you can remain solvent”.
Parabolic Shorts are never the consensus. In markets, the crowd’s sentiment is heavily influenced by short-term price fluctuations, so you have to be comfortable going against the the trend, which is not easy. If a stock is setting up for a Parabolic Short, that means its made a large, powerful move up and one of the hottest stocks in the market. You’ll see a flood of opinions, headlines, news, and chatter regarding the stock. From experience, I can tell you all that noise is nothing but a distraction. At the end of the day, it’s all about positioning, price, and volume.
With that out of the way, let’s explore the Parabolic Short setup, covering its definition, the reasons behind its occurrence, and my approach to identifying and trading these high-conviction opportunities.
What is a Parabolic Short Setup and Why Do They Occur?
George Soros’ Theory of General Reflexivity provides a powerful framework to understand the dynamics behind a parabolic short setup in stocks, as it explains how market prices can deviate significantly from underlying fundamentals due to self-reinforcing feedback loops between perception and reality.
Soros’ theory rests on two key principles: fallibility and reflexivity. Fallibility means that market participants—traders, investors, or speculators—base decisions on flawed or biased perceptions rather than objective reality. Reflexivity describes how these perceptions influence actions that alter the market’s reality, which then reshapes perceptions, creating a constant feedback loop. On occasion, these parabolic shorts are fueled by gamma squeezes, which also contribute to that constant feedback loop. In a Parabolic Short setup, this dynamic is what drives the rapid, unsustainable price surge.
A parabolic move occurs when a stock’s price rises steeply in a short period, often appearing as a near-vertical curve on a chart. According to Soros, this is not just a reflection of fundamentals (e.g., strong earnings or news) but a reflexive process where rising prices fuel optimistic perceptions, which in turn drive more buying, pushing prices further upward. This creates a bubble-like trend—a hallmark of the Parabolic Short.
Soros describes how reflexive trends eventually face a “test” that exposes the disconnect between perception and reality. In a Parabolic Short setup, this could be a disappointing earnings report, short report, negative news/catalyst, or heavy selling pressure. When the optimistic perception falters, participants begin to panic sell, triggering a sell off. The same reflexive mechanism that drove the rise now works in reverse: falling prices erode confidence, prompting more and more selling, leading to a rapid drop.
The best Parabolic Shorts present themselves on very rare occasions. You’re lucky to get a couple 5-star candidates a year. These parabolic moves are often unsustainable, driven by pure hype, speculation, and fear of missing out. Picture a rubber band: the more you stretch it, the harder it snaps back. Stocks are no different. Nothing can go straight up forever, the mean reversion always comes.
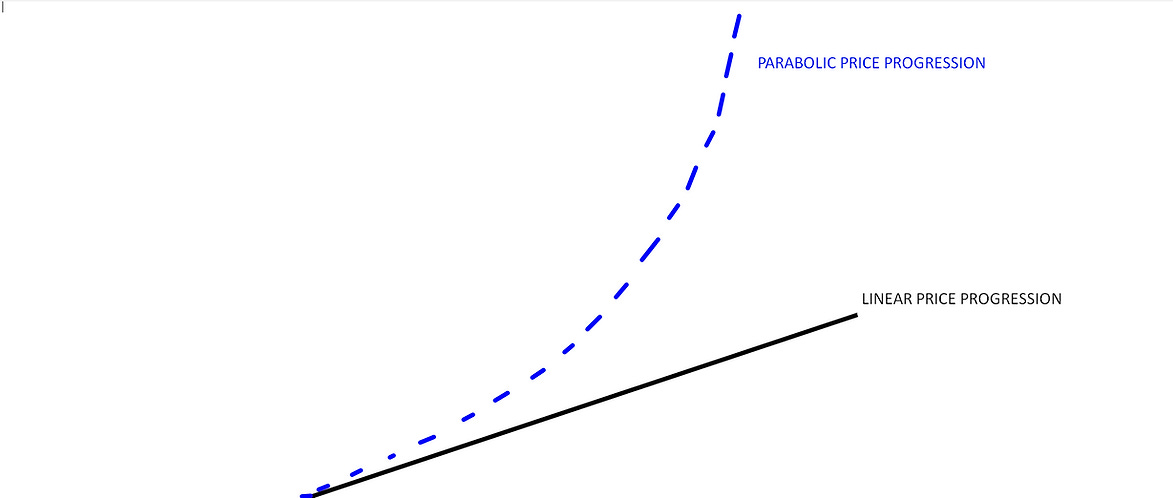
Parabolic Price Progression
The initial step in identifying a Parabolic Short setup is determining whether the trend follows a parabolic or linear curve, a skill that is developed by studying historical examples and training the eye. A parabolic curve is defined by an exponential, rapidly accelerating price surge that forms a steep, upward arc, while a linear curve exhibits steady, consistent price movement over time, indicating stable and predictable growth or decline.
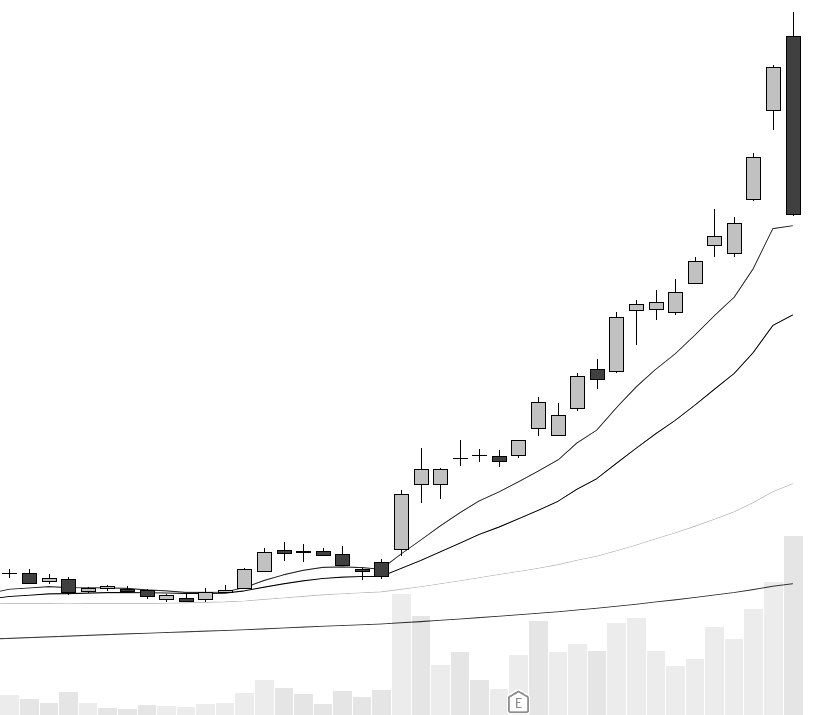
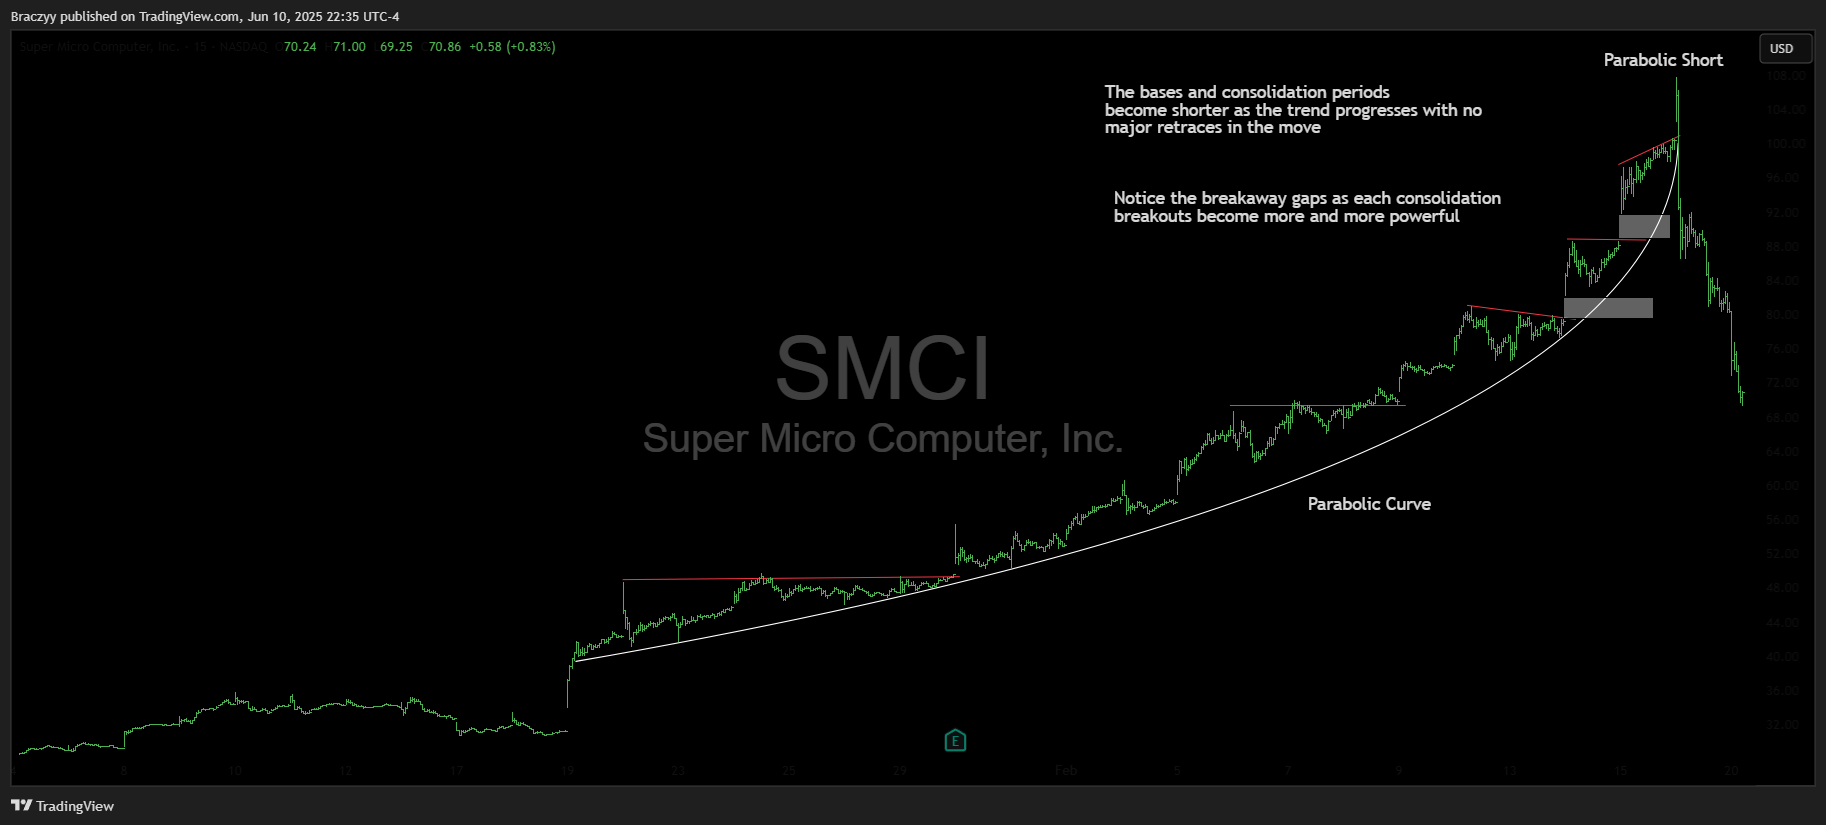
You must understand the behavior of a parabolic trend, focusing on two key aspects: the duration of consolidation or basing periods and the extent of retracement as the trend advances. Ideally, consolidation periods shorten as the price surges higher, with minimal pullbacks, signaling accelerating momentum. For instance, examine the SMCI 15-minute chart from February 2024, where tightening consolidation periods fueled an exponentially steepening parabolic curve.
The daily chart of AAPL in late 2023 shows a significant upward move, extended from the 50- and 200-day moving averages, but it progresses in a stair-stepping pattern known as linear progression. This steady, controlled ascent, which you should avoid for Parabolic Short setups, reflects sustained strength and can persist for an extended period.

Another defining characteristic of a parabolic curve is the significant expansion in both price and Average True Range (ATR) as the trend accelerates. ATR, a technical indicator measuring a stock’s average volatility by averaging the true range (the greatest of the current high-low, high-previous close, or low-previous close) over a set period, surges notably in the late stages of a parabolic move compared to a linearly trending stock. The daily chart of Bitcoin from 2017 vividly illustrates this price and ATR expansion, highlighting the explosive momentum characteristic of a parabolic trend.

The Parabolic Burst
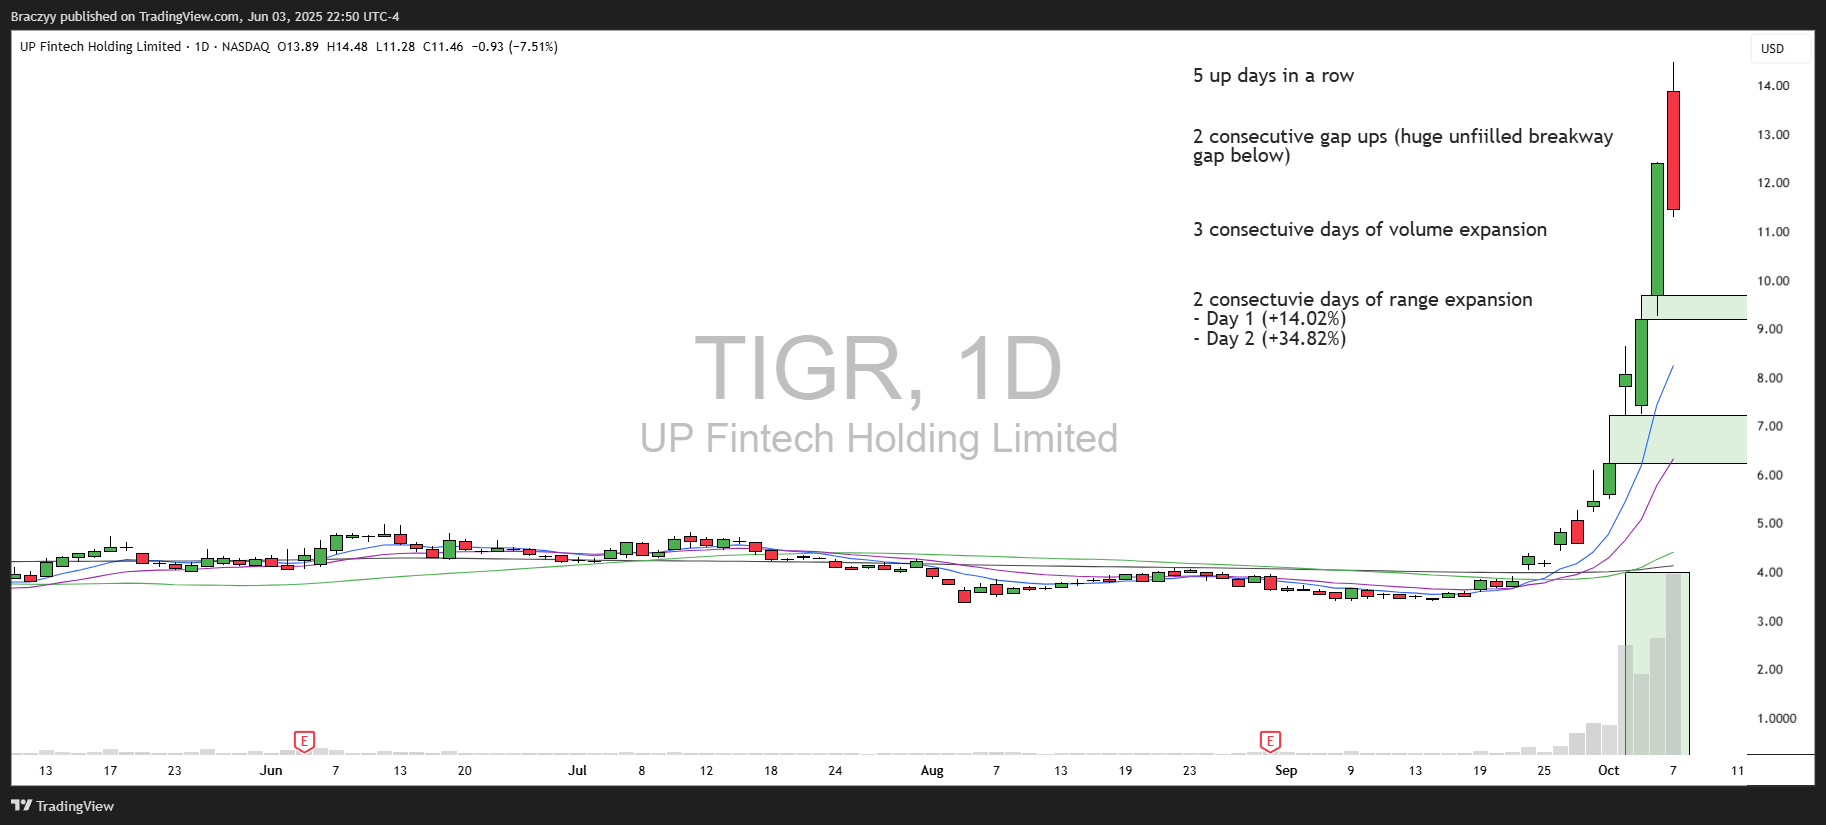
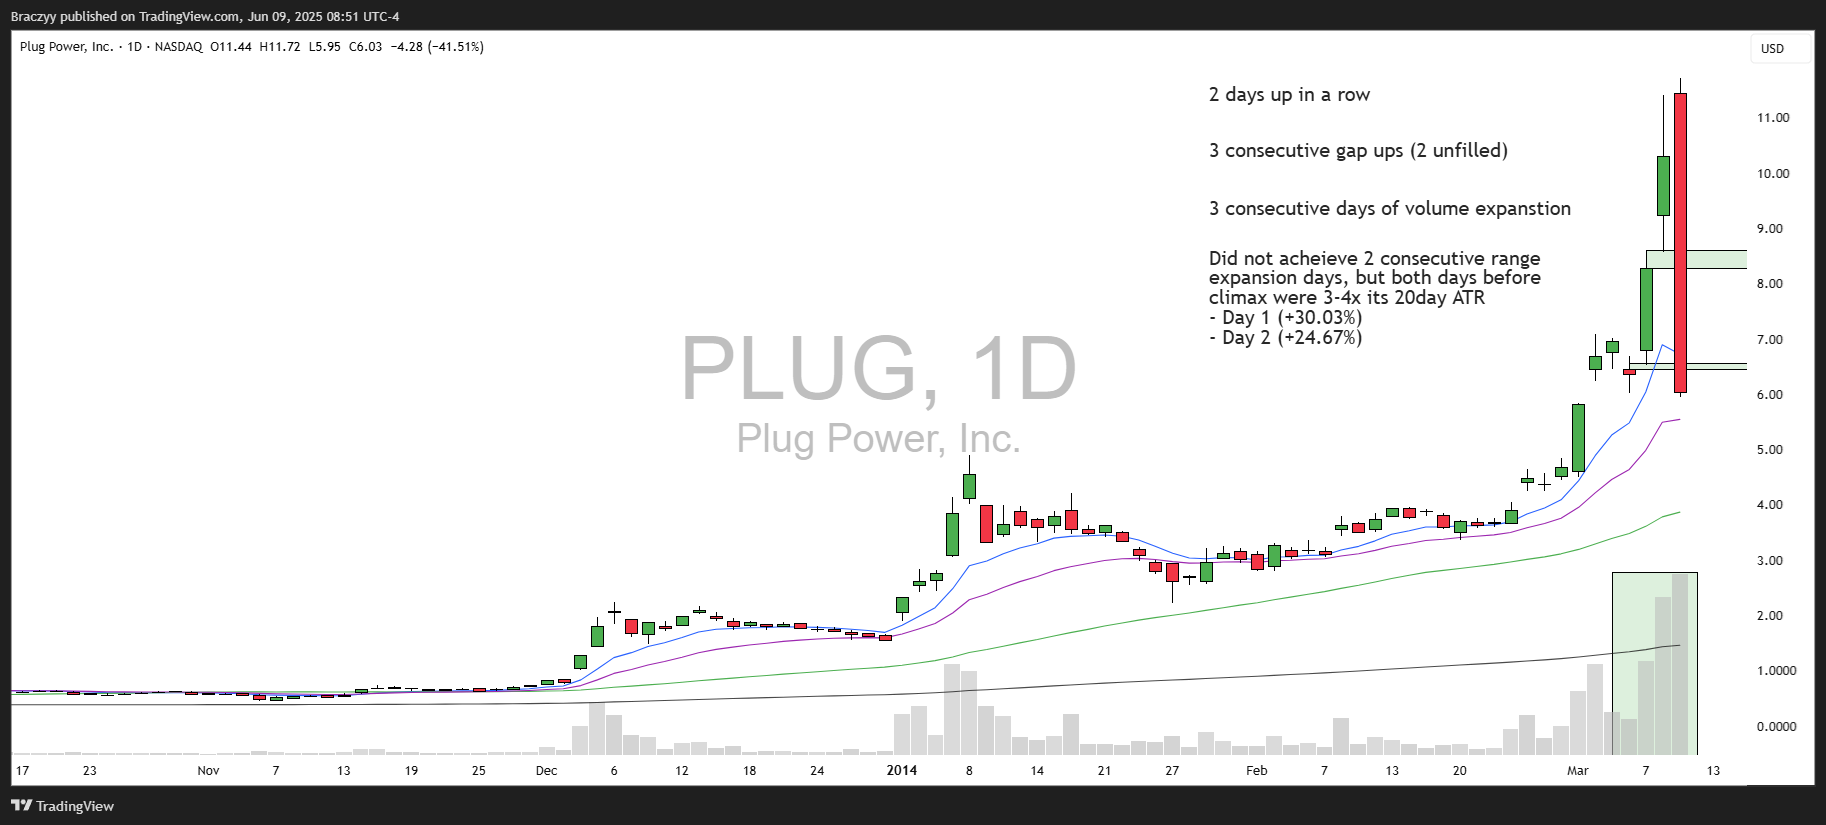
This is a term I created to help identify and time a Parabolic Short correctly. This parabolic burst is a 3-5 day move that marks the final leg of a parabolic move. It is typically the most irrational stage of the move, where range and volume expand significantly. This burst is the common denominator among all Parabolic Short setups that I have studied.
Here are a few of my criteria for a stocks move to qualify as a parabolic burst:
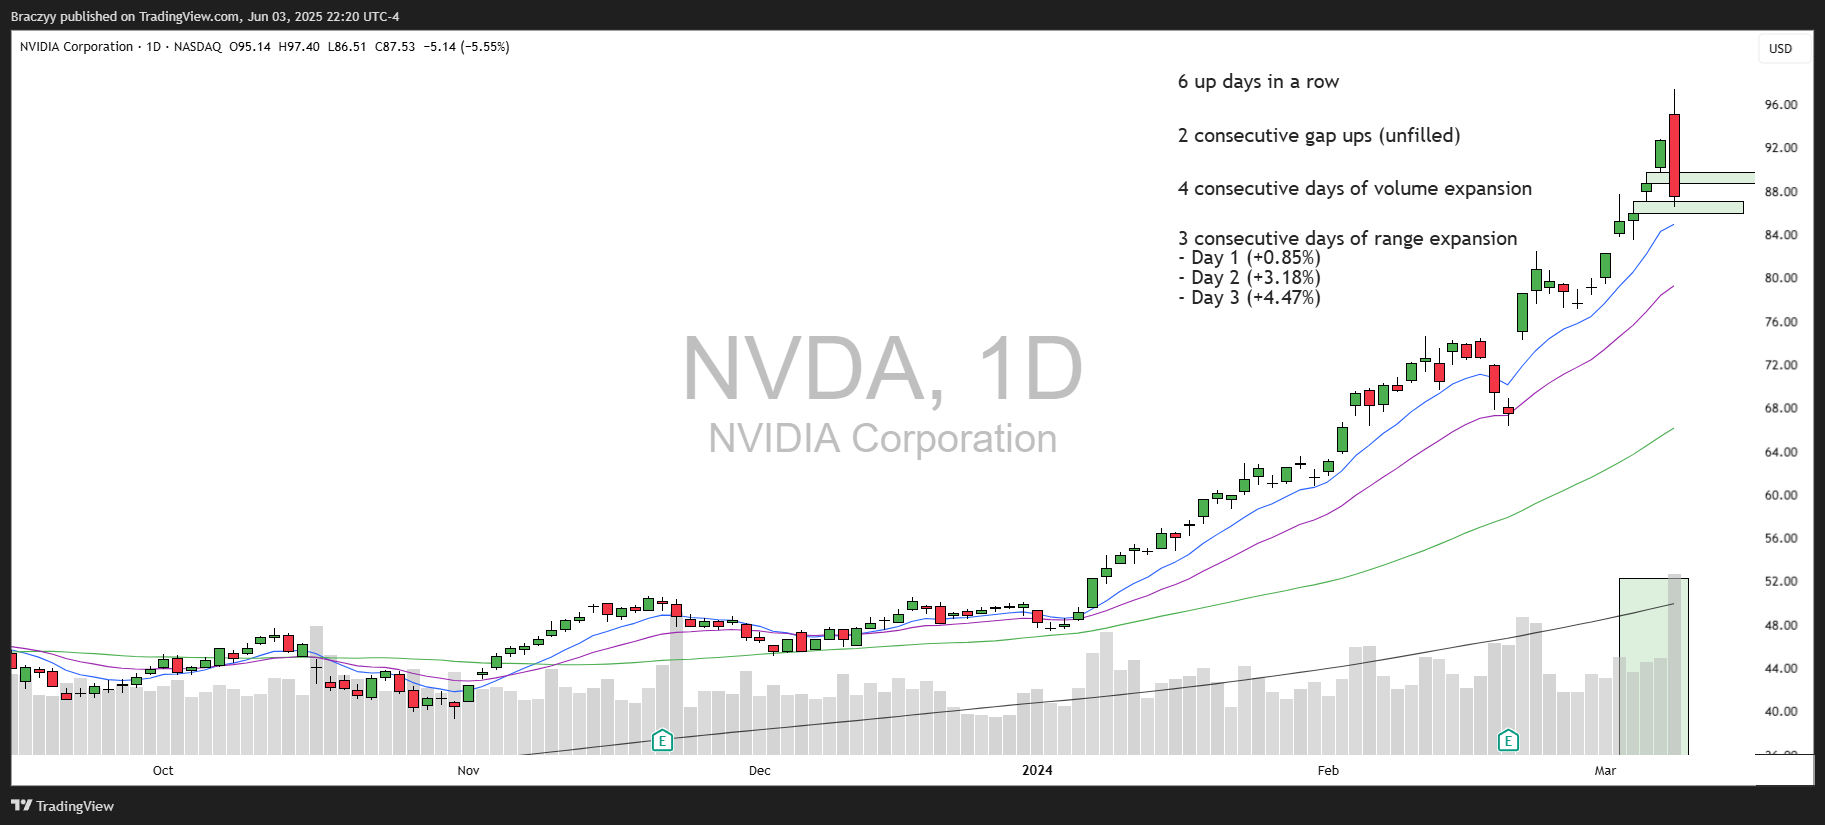
Three straight days of gains. The more consecutive up days, the better the setup.
Two consecutive overnight gap ups. This can include the exhaustion gap on the climax day. Unfilled gaps left behind is a bonus.
Two out of three days of range expansion, where the percentage gain is larger than the previous day. Ideally consecutive range expansion days.
Two days of volume expansion, with each day’s volume higher than the last.
A gap-up on the climax day. You never know exactly when the climax day will hit, but I won’t short without that gap-up. (The climax gap up typically takes place on day 3 to 5 of the move.)
While not every criteria needs to be fully satisfied, the more boxes checked, the stronger the setup. Treat these criteria as a checklist to grade the opportunity’s quality; for instance, a stock might only have two consecutive up days before the climax, but if the two day move shows significant short-term price and ATR expansion, it remains a viable candidate, particularly when other conditions are met.
5-Star Parabolic Short Examples (All include “Parabolic Bursts”)
SMCI 2/16/2024

NVDA 3/8/2024
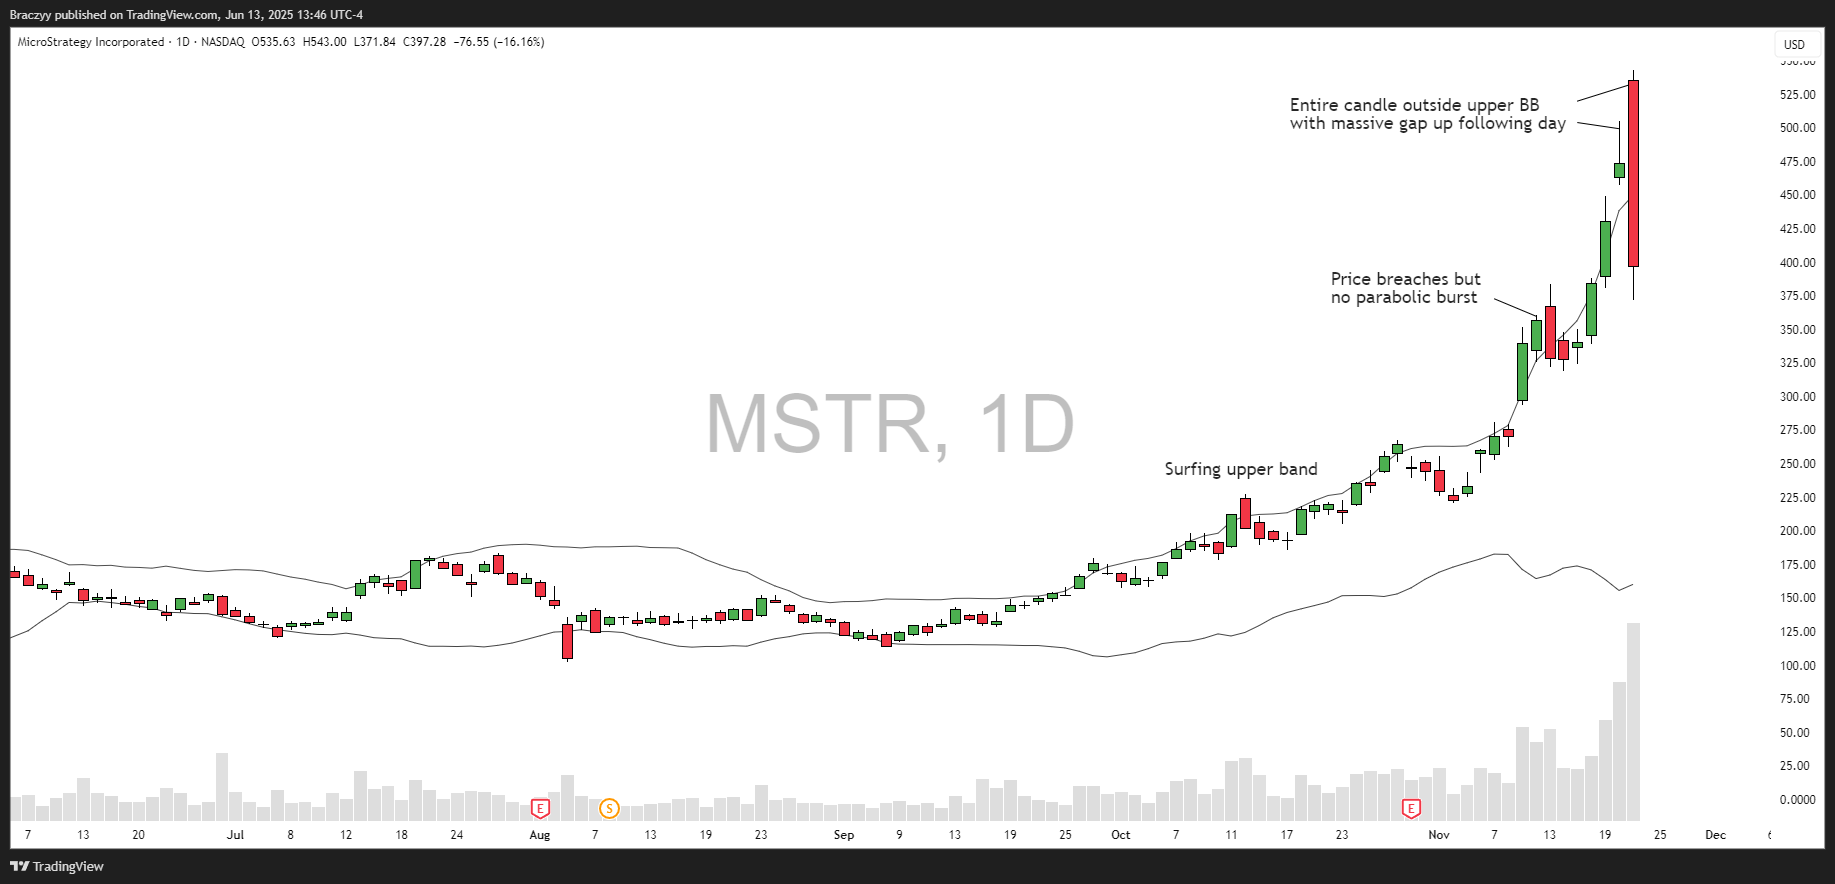
MSTR 11/21/2024

TIGR 10/7/2024
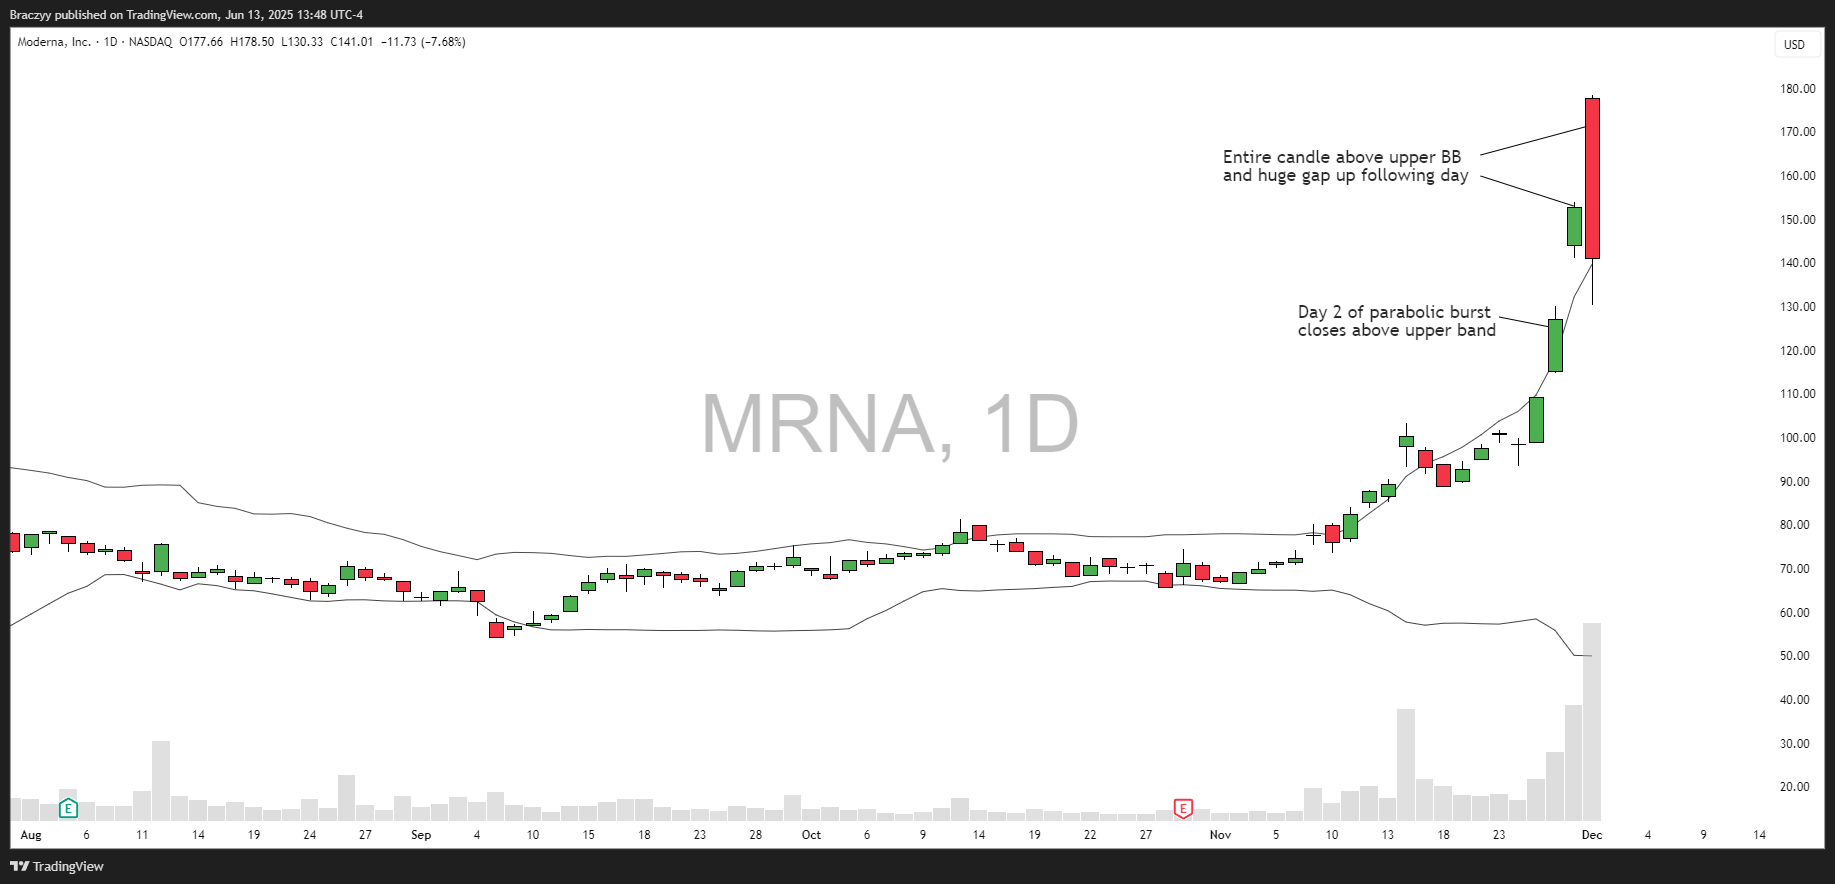
MRNA 12/1/2020

PLUG 3/11/2014
Climax Day
On the climax day—the peak of the parabolic move—the first requirement is a significant overnight gap-up, typically occurring on day 3 to 5 of the Parabolic Burst, signaling potential exhaustion and setting the stage for hunting intraday short setups.
One intraday setup to watch for is the Quick Opening Range Breakdown, which occurs at market open when the day's high is set on the first 5-minute candle, with an entry triggered by a breakdown below the 2- or 5-minute opening range. This setup, though less frequent and more challenging, requires caution as it often appears on day 1 or 2 of the Parabolic Burst—typically too early in the move—leading to limited follow-through and potential short traps that drive the stock higher for the rest of the session. While I’m not particularly fond of this pattern, it can occasionally emerge on the climax day, offering a viable short opportunity if timed correctly.
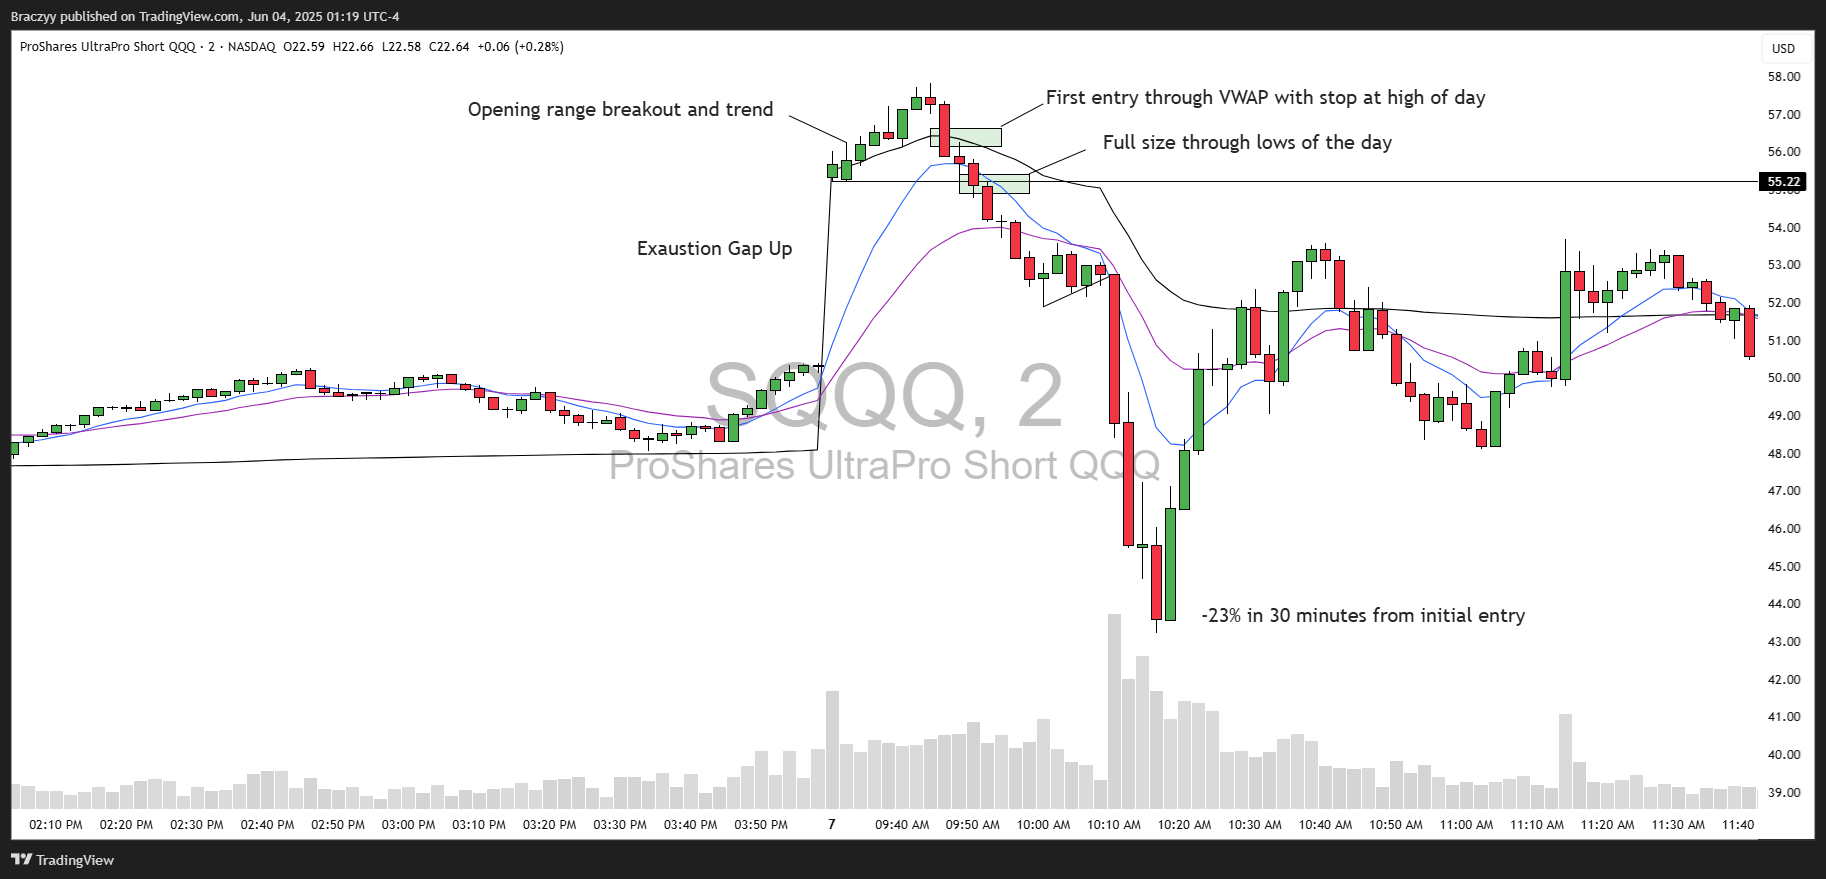
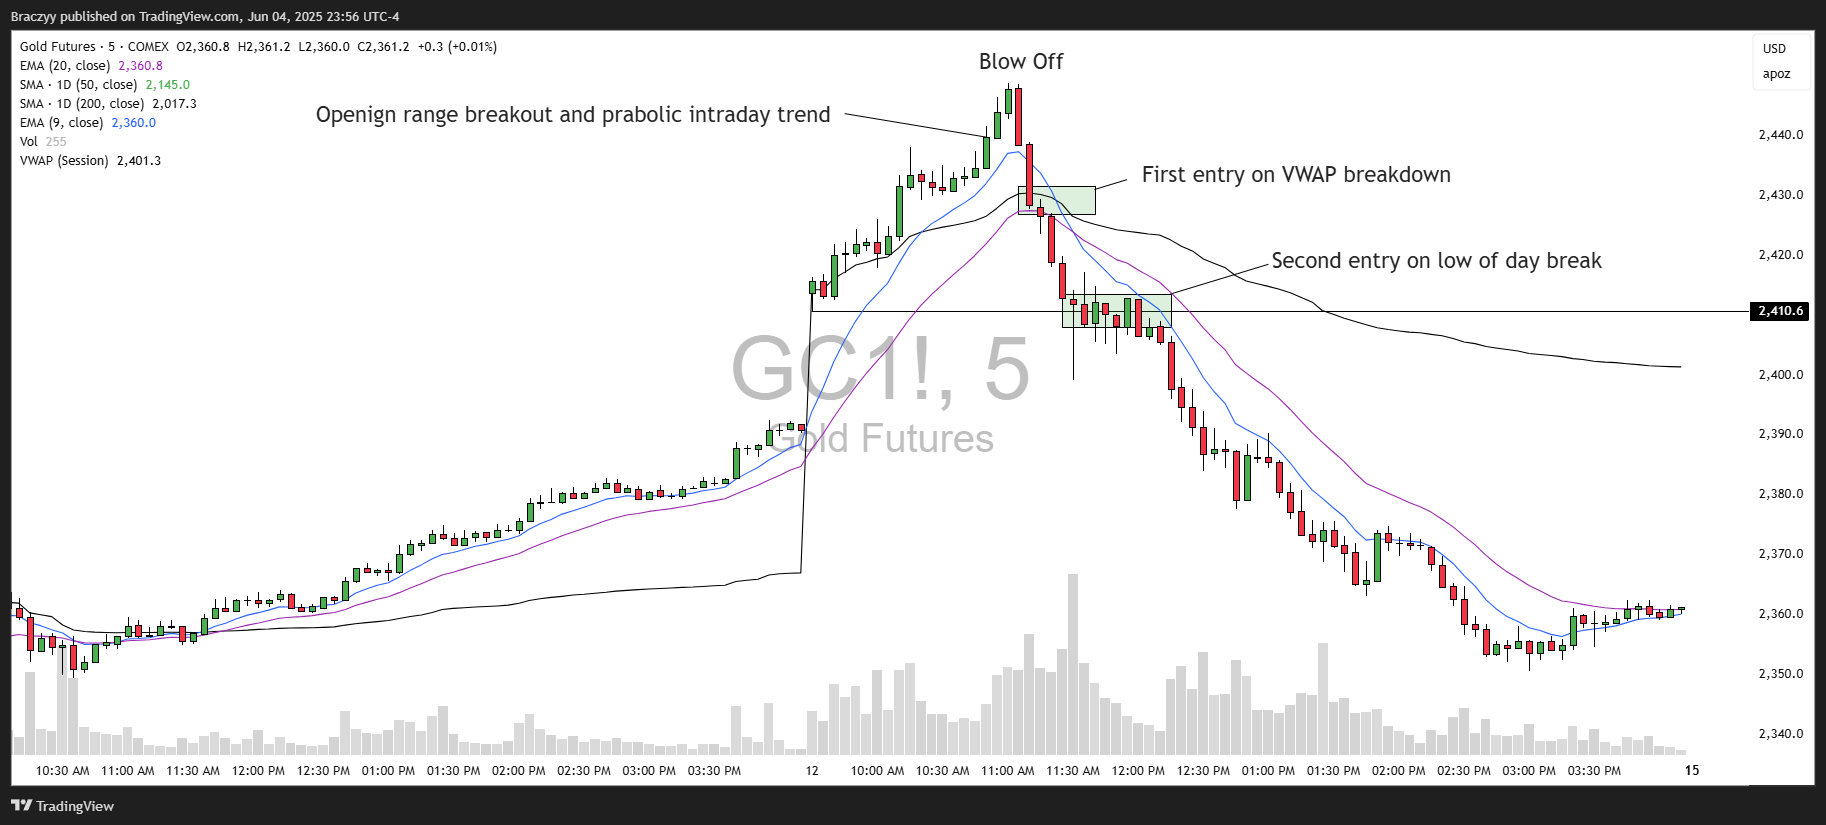
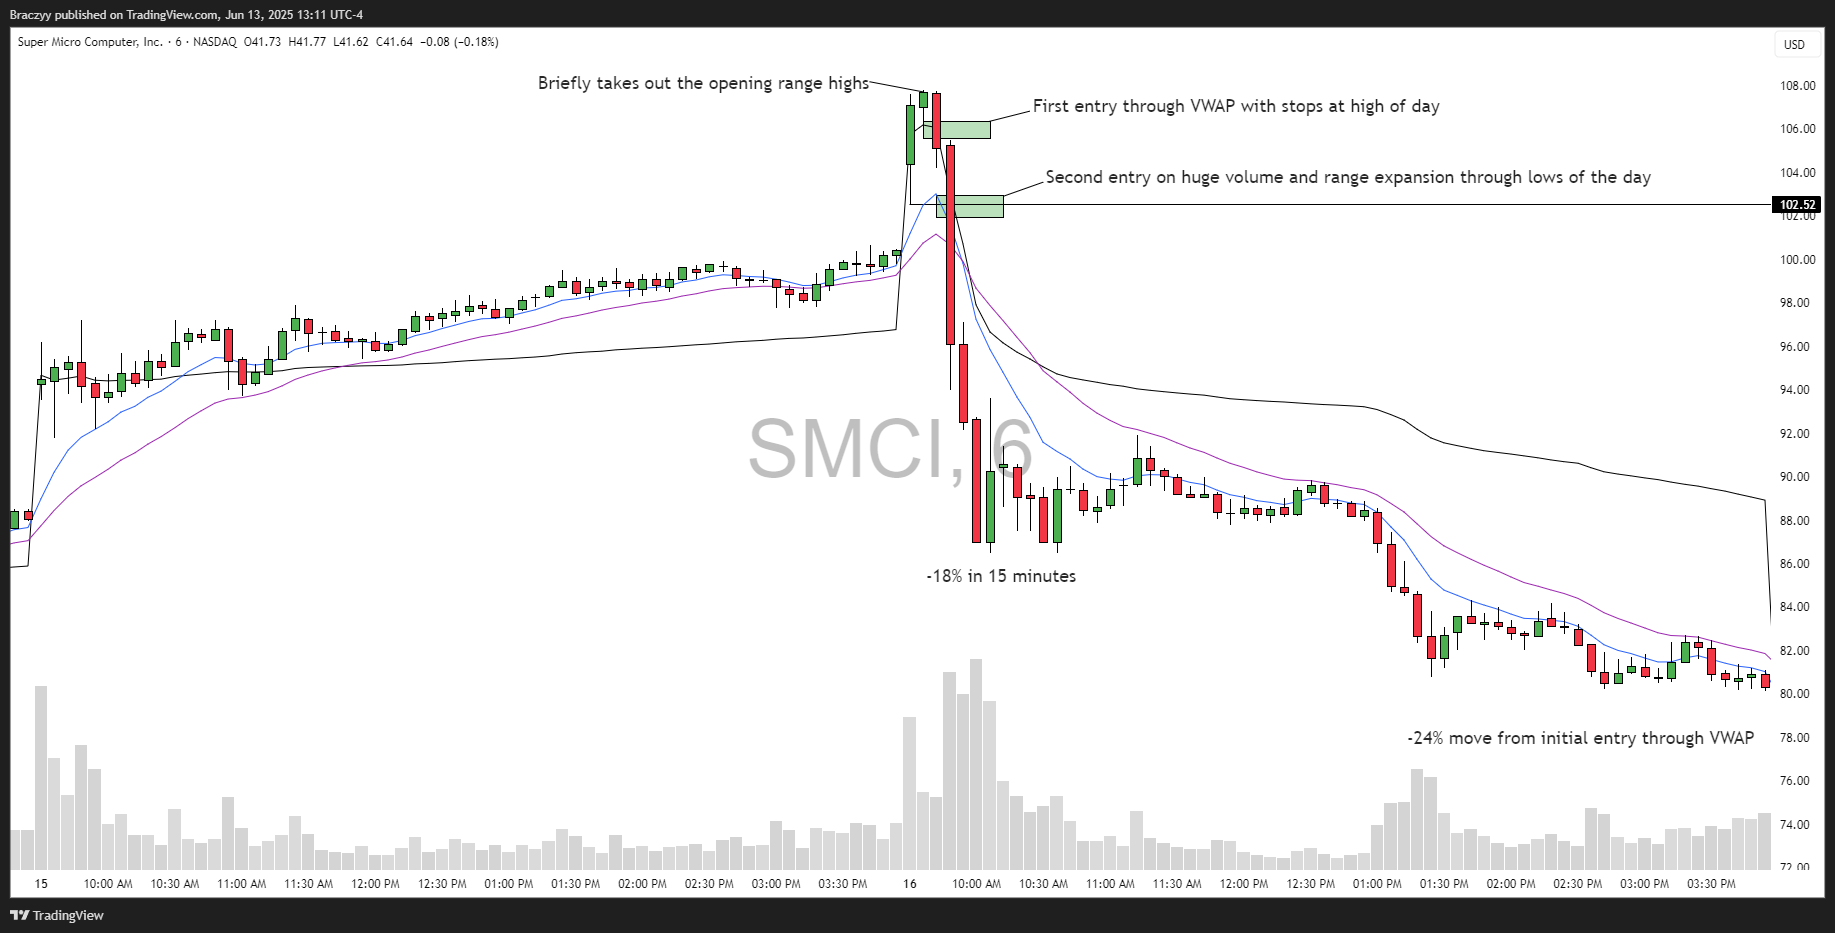
My preferred intraday setup, which I dubbed the “U-Turn,” is the most prevalent intraday short setup on the climax day based off of the Parabolic Shorts I’ve analyzed. It begins with a gap-up and an opening range breakout, driving an upward trend at the open—sometimes a steady climb, other times a dramatic parabolic spike for a finale. This surge lures in chasers, creating the illusion of another explosive up day. However, typically 10 to 60 minutes after the market opens, sellers emerge, and the stock starts to reverse. The first entry is triggered by a breakdown below VWAP, followed by a second short opportunity when the stock breaches the day’s lows. On a true climax day, this selling continues to intensify, accelerating the decline.
The third and less common intraday setup, which I call the “Long-Drawn-Out Range Breakdown,” occurs when a stock forms a tight trading range during the first one to two hours of the session. Eventually, it breaches its intraday support, breaking out of the range and accelerating downward. This setup is trickier to trade, as the stock often appears “choppy” and untradable before suddenly dropping mid-to-late day. I observe this pattern more frequently in 3- or 4-star Parabolic Short setups that don’t fully meet all criteria.
The execution is where the “Right Side of the V” comes into play, a concept I picked up from Lance Breitstein. This strategy refers to entering a trade after a stock's price reverses from a sharp incline or decline (forming a V-shape), aligning with the new intraday trend for higher-probability, lower-risk entries. This is essential to maximize expected value and protect yourself from big losses, especially when trading against the macro trend. For a parabolic short, I am always waiting until the intraday trend flips to the downside. I will never take an entry until the stock at least breaks below the intraday VWAP (Volume Weighted Average Price). Shorting at the day’s highs can be a dangerous trap—every reversal candle will feed your bias, but the stock often keeps grinding higher. That’s a classic rookie mistake with this setup and it’s how you get crushed. The goal isn’t to short at the absolute top or chase the perfect price—it’s about getting the “right” price, where the odds are heavily in your favor. On climax days, these stocks can make huge downside moves—think 5-15% for large caps and 20-30% for mid- or small-caps. I don’t care to catch every single percent; I’m just focused on capturing the easiest part of the move with conviction and size.
I’ve observed some traders use a strategy called “pyramiding” for Parabolic Short reversions, which consists of building a position against the trend to anticipate a reversal. This can be highly profitable if executed well but risky without the discipline to cut losses quickly. I haven’t explored pyramiding myself but may study it further in the future, as waiting for the intraday trend is more suitable for my style.
Let’s take a look at some intraday examples of the “quick opening range breakdown” and the “u-turn”:
MSTR (Quick Opening Range Breakdown)

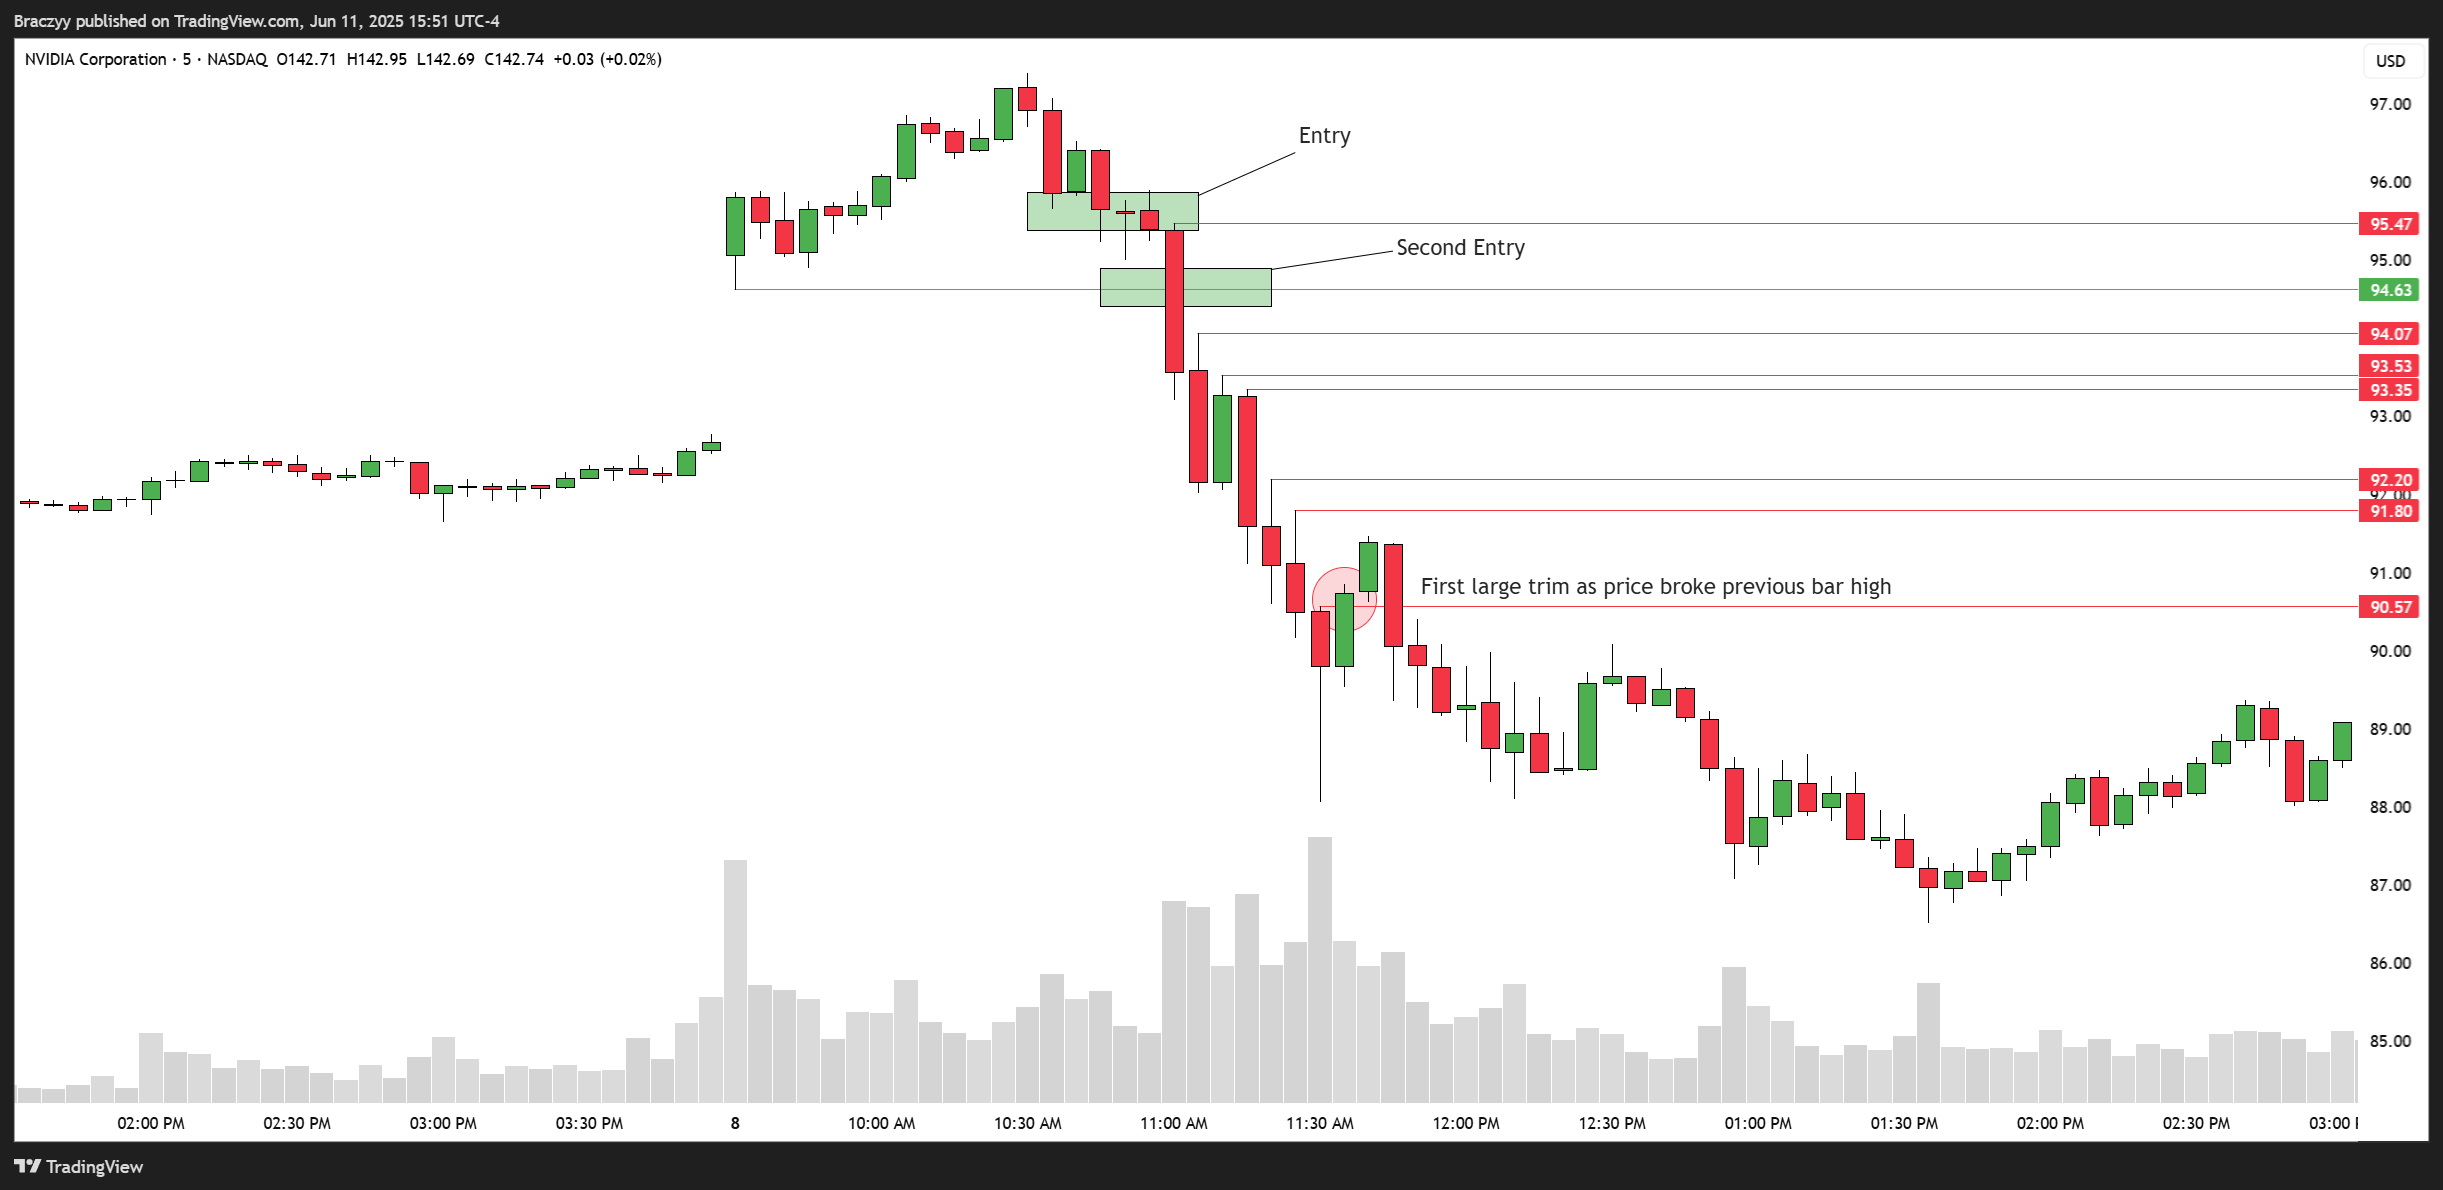
NVDA (U-Turn)

SQQQ (U-Turn)
/GC (Gold Futures - U Turn)
SMCI (U-Turn)
Gamma Squeezes and Options: Fueling Parabolic Surges and Unwinds
As I briefly mentioned earlier, some large cap Parabolic Shorts can be amplified by gamma squeezes, where heavy call buying forces market makers to purchase shares to hedge, driving prices higher in a self-reinforcing cycle. Let’s dive into how that works:
Parabolic Rally (Gamma Squeeze):
- Heavy call buying increases option deltas, forcing market makers to buy shares to hedge, amplified by gamma.
- IV spikes and short covering drive exponential price moves higher, fueled by FOMO
Parabolic Short (Unwind):
- Call buying slows, options expire, or hype fades, reducing gamma and prompting market makers to sell shares.
- IV crush lowers deltas, and charm accelerates selling near expiration, creating a liquidity vacuum.
- Profit-taking, panic selling, short re-entry, and fundamental reversion drive a rapid drop
When a gamma squeeze lines up with the technical setup for a Parabolic Short, it significantly enhances the trade’s potential. These moves often peak or unwind on Thursdays or Fridays, especially right before or on monthly option expirations, where most open interest is concentrated, setting the stage for sharp unwinds and reversals.
I’m not an options market expert, but I have a working understanding of the basics. You don’t need deep options knowledge to trade Parabolic Shorts, but it can give you an edge. One useful tool I picked up from Steven Place is a simple way to spot an ongoing gamma squeeze. He suggests tracking the distance between the 20-delta call strike and the underlying stock’s price. If this distance holds steady or widens, it signals rising implied volatility (IV), with time premium (theta) outweighing volatility premium (vega). This indicates the market expects continued upward momentum, keeping the gamma squeeze alive—making it a risky time to short, as options-driven buying props up the stock. Conversely, if the distance narrows, it suggests the gamma squeeze is fading. The stock price is catching up to or surpassing the 20-delta call strike, often as IV drops (volatility crush) or call buying slows. This signals the unwind, where market makers sell their hedges, triggering a rapid collapse that often aligns perfectly with the Parabolic Short climax.
Using this concept isn’t a completely foolproof strategy itself, but can help add conviction to the short idea, while also preventing you from shorting too early in the move. Remember, the distance metric requires context. A narrowing distance between the 20 delta call and underlying price doesn’t guarantee an immediate reversal; it could just mean a pause before another leg up if fundamentals or sentiment remain strong. This concept is most powerful when combined with precise technical analysis.
Execution Vehicle
Choosing the right vehicle for a Parabolic Short can be as challenging as identifying the setup itself. Each vehicle i’ve used—short equity, long inverse leveraged ETFs, or put options—has unique risks and rewards, and selecting the wrong one can undermine even a well-timed trade. The best choice depends on several factors such as the stock’s liquidity, volatility, and options pricing.
With that in mind, let’s look at a few previous parabolic shorts and which vehicles I used to capitalize on them:
SMCI - SMCI’s February 2024 gamma squeeze, culminating on the third day of its Parabolic Burst ahead of monthly option expiration, set the stage for a rare climax and unwind triggered by an exhaustion gap-up on Friday. What elevated this to a once-in-a-decade opportunity was the severely mispriced (inexpensive) 0DTE options on OPEX, creating a “broken slot machine” scenario where market makers and participants were completely caught off-guard. The OTM 0DTE $900 strike put options I traded went +4,000% from entry in just an hour, making 0DTE options the optimal vehicle and one of the highest expected-value day trading opportunities I’ve ever encountered.
MSTR - The MSTR setup was a textbook Parabolic Short, amplified by intense social media hype, but its elevated implied volatility made the options expensive, unlike the exceptional SMCI opportunity. Climaxing on a Thursday, it missed the ideal Friday window for 0DTE puts, where I’m comfortable risking 100% of the premium for a potential 5-10x return, bypassing the need for precise stop-loss timing—either it works or it doesn’t. However, short dated options limit position size compared to shorting equity, especially when implied volatility is elevated. One sharp move against you can crush them, requiring cautious sizing to cap losses at the premium paid. I took a small position in puts, securing a decent profit, but traded most of my size in the inverse leveraged ETF “MSTZ,” which surged 93% from its intraday low to high on MSTR’s climax day.
NVDA - I traded the options on NVDA, a rare mega-cap presenting a Parabolic Short opportunity. Its high liquidity and relatively lower volatility made 0DTE options attractively priced for that Friday’s trade. Fresh off a successful SMCI trade just three weeks prior, I found NVDA’s execution pretty straightforward, as its daily and intraday technical setup closely mirrored SMCI’s. The OTM puts I traded delivered a 10x return from entry in just 35 minutes.
These three 2024 examples—SMCI, MSTR, and NVDA—illustrate trades I executed using options or leveraged ETFs, but for beginners, shorting equity is the simplest way to learn the Parabolic Short setup, as it avoids the complexities of inverse ETF leverage or option volatility, allowing you to focus purely on mastering the technical aspects of the trade, which is the first step.
Target and Exit Strategies
My target for a Parabolic Short is consistently the 9-day exponential moving average (9EMA), which my studies show acts as a magnet for mean reversion, typically serving as the stock’s first significant support level. Every parabolic short I’ve analyzed reaches the daily 9EMA before any counter-trend rally emerges, though holding until it hits isn’t mandatory—it’s a guide to estimate the potential downside. Once the 9EMA is tested on the backside of the move, I consider the Parabolic Short complete, focusing solely on capturing the intense mean-reversion phase. A stock in a Parabolic Burst will inevitably revert to the mean—a certainty if the setup is clear and timed precisely. Post-reversion, the stock might consolidate and make new highs again or may never recover from its parabolic peak; I’ve seen both outcomes, but after the short-term reversion, the next move is much more unpredictable and irrelevant to my strategy.
For stop losses, I prefer waiting for a trend reversal and a breakdown below VWAP for my first entry, setting my initial stop at the day’s high, as my thesis assumes the trend has reversed and the top is in. While this can be challenging when the day’s high and VWAP are far apart, they’re typically close enough to manage. If the price reclaims the day’s high, I deem my thesis or timing incorrect and exit the trade. If the trade moves in my favor and breaks below the day’s lows, I take my second entry. Once fully positioned, I adjust my stop from the day’s high, trailing it at the previous 5-minute bar highs and either the 5-minute 20EMA or VWAP (detailed below). In a true 5-star Parabolic Short setup with precise timing, stocks rarely reclaim the day’s high or VWAP; instead, the decline often accelerates sharply after the breakdown.
The “Previous Bar High” trailing method, another technique I adopted from Lance Breitstein, enables you to remain in high-momentum trades with substantial size. After getting full sized on the short position at the day’s lows, I trail most of my position at the previous 5-minute bar high; once triggered, I shift the remaining stop to trail the 5-minute 20EMA or VWAP, based on the setup’s quality and price action characteristics.
A prime example is NVDA in March 2024, where, after a textbook entry through VWAP and the day’s lows, the price didn’t breach the previous 5-minute bar high for 40 minutes. While this meant giving back some profit from the low as the trend softened, it secured 70% of the move with full size, avoiding premature trims on minor pullbacks or panic-selling during mid-trend bounces. This intraday trailing strategy is essential for me to maximize risk-to-reward in extreme momentum scenarios, like the Parabolic Short.
Relative Volume at the Open
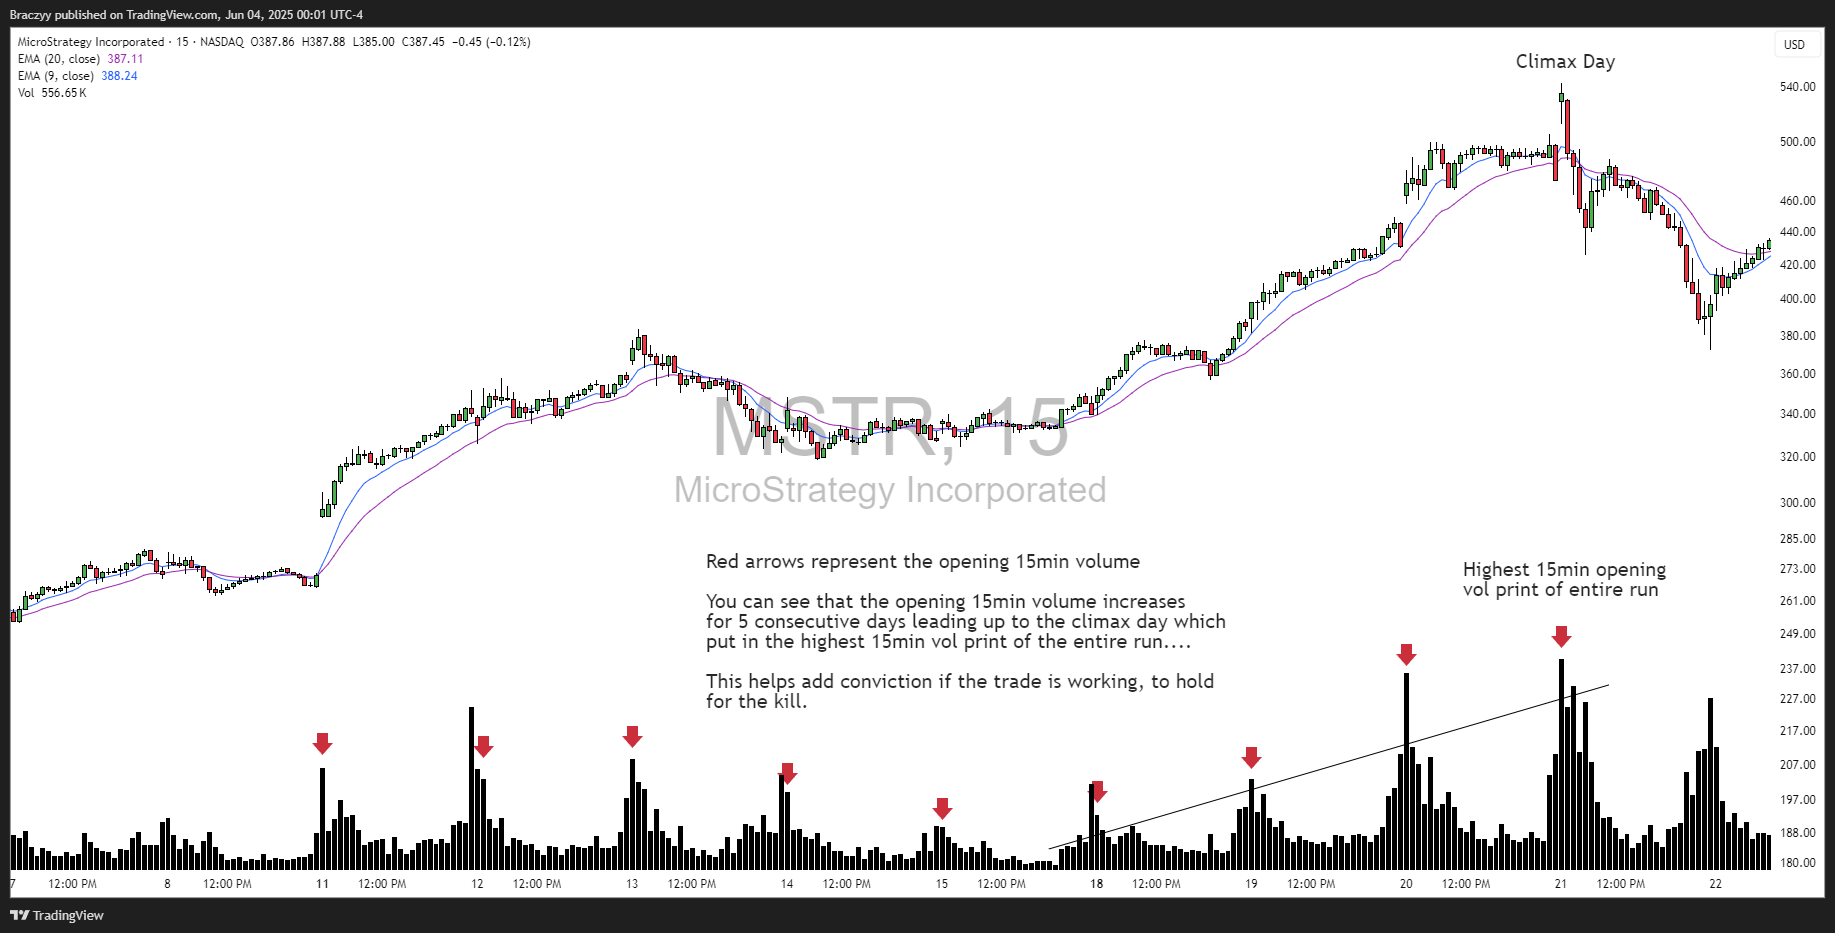
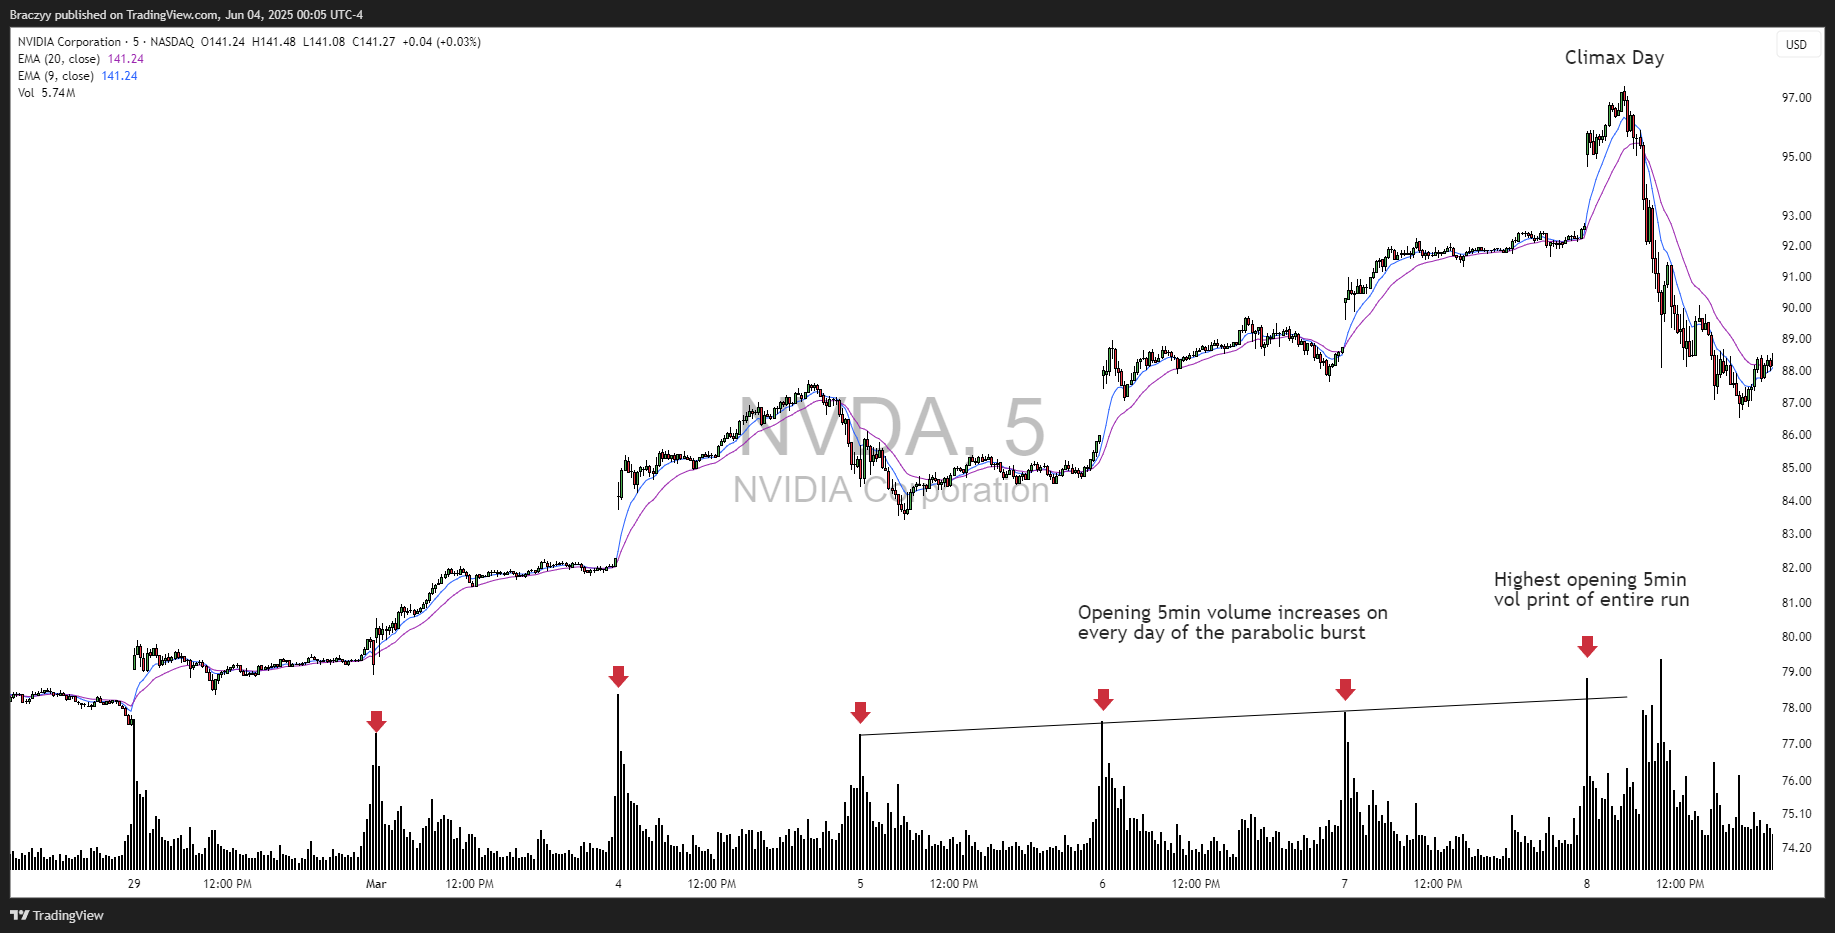
To boost conviction when I suspect the climax day has arrived or to help confirm a stock is in a Parabolic Burst, I closely monitor the volume on the opening 5- or 15-minute candles. Leading up to a Parabolic Short, opening volume typically rises consecutively over several days, with the climax day almost invariably showing the highest opening volume of the entire run. This surge significantly drives the massive daily volume spike visible on the chart post-climax. Ideally, you want increasing opening volume on the 5-, 15-, or 65-minute timeframes throughout the Parabolic Burst phase. Let’s illustrate this using a combination of 15- and 5-minute timeframes with a few of the examples mentioned earlier.
MSTR (15-minute)
NVDA (5-minute)
SMCI (15-minute)

Bollinger Bands
Bollinger Bands serve as a key indicator I use to reinforce confidence in the Parabolic Short setup, measuring market volatility by plotting two standard deviations above and below an asset’s simple moving average, signaling potential overbought or oversold conditions. A price breach above the upper Bollinger Band or below the lower band is typically short-lived, often foreshadowing a counter-trend snap back move, making it a valuable tool for identifying and timing parabolic reversions, though it should not be solely relied upon. It is most valuable when combined with other indicators and characteristics discussed above.
Here are the examples above with daily Bollinger Bands added:


Variations of the Parabolic Top Formation
In my studies, there are a few different types of “Top Formations” for a parabolic short that I have not yet discussed. Many stocks make parabolic moves, but not all of them unwind in the same fashion. My favorite version is the examples I shared above. A parabolic burst into a final gap up on climax day, where it opens higher, and closes lower. Kristjan Kullamägi says “Unlike long setups where you can score a 20-30x risk-reward, parabolic shorts typically offer a 5-10x risk-reward.” That’s why it’s critical to wait for the absolute best setups to tilt the odds in your favor and keep your win rate high—it’s got to be worth your time and capital. This is the reason why I’m highly selective and hold out for that final exhaustion gap-up on the climax day. It is more rare to come across, but much easier to identify and significantly tilts probabilities in your favor. But for educational purposes, you should study and make yourself aware of all the different variations of parabolic tops.
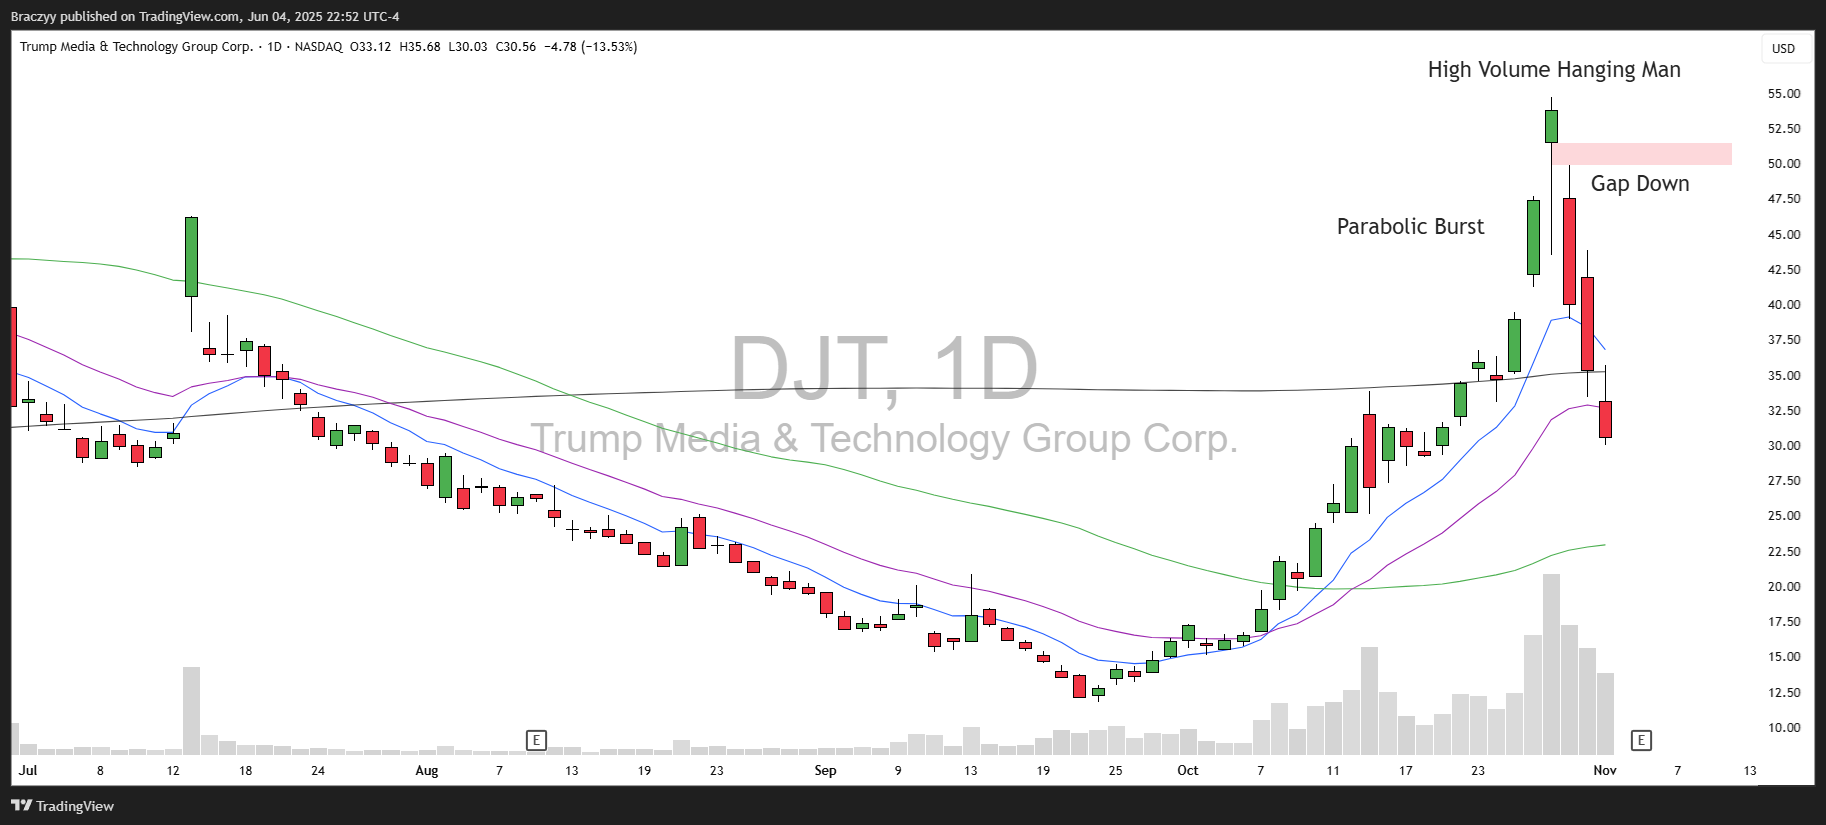
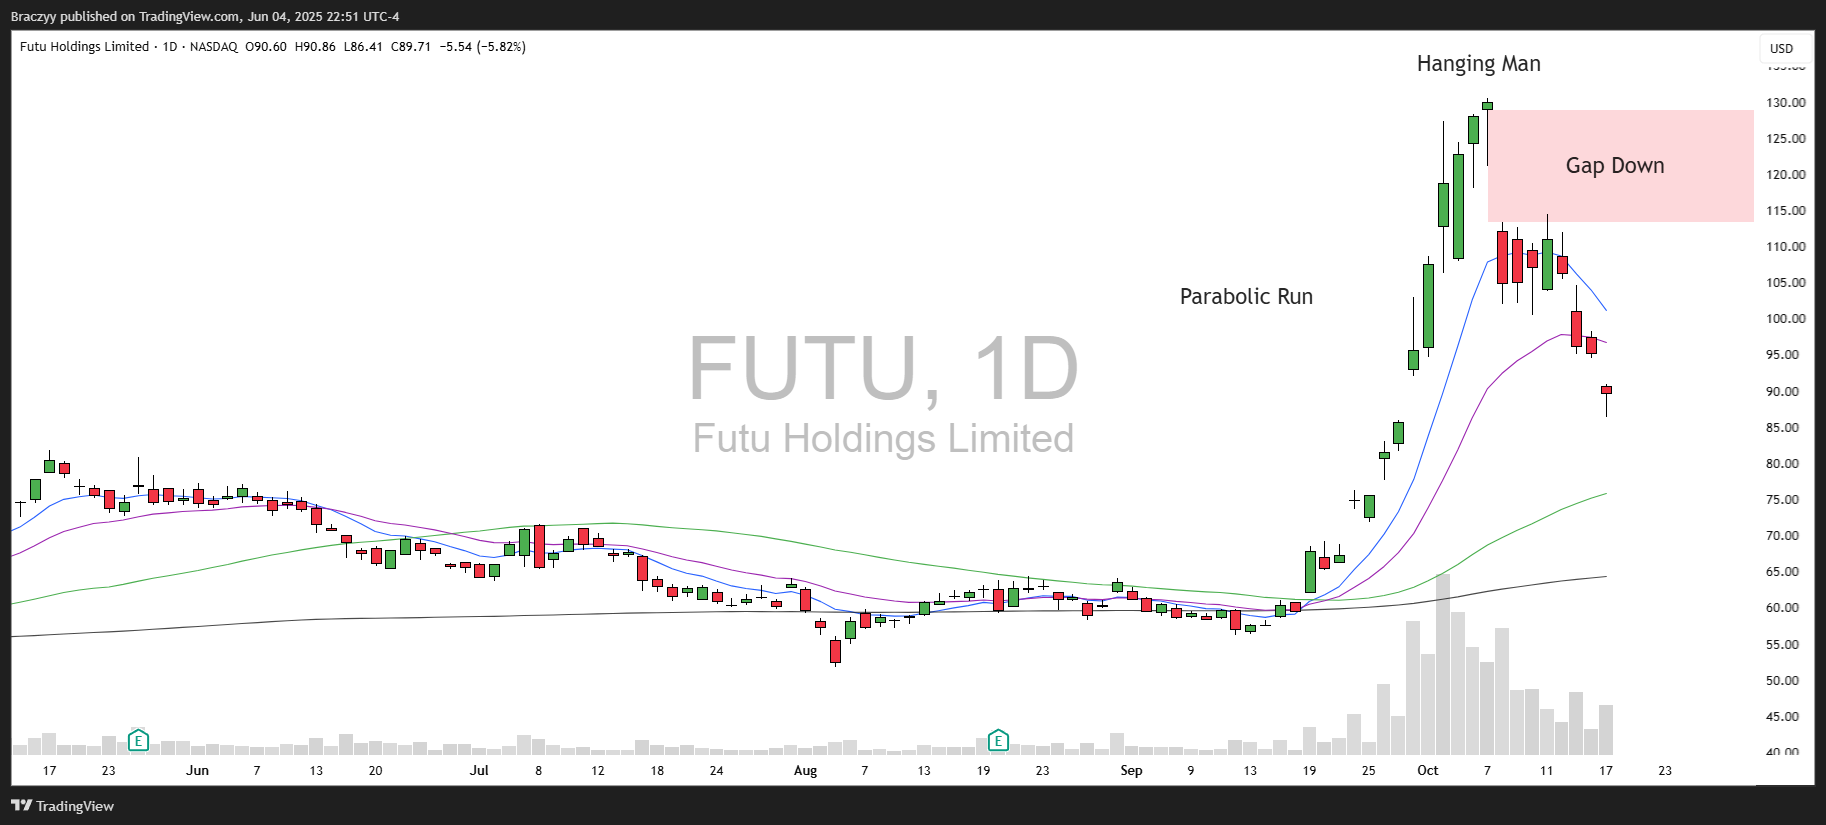
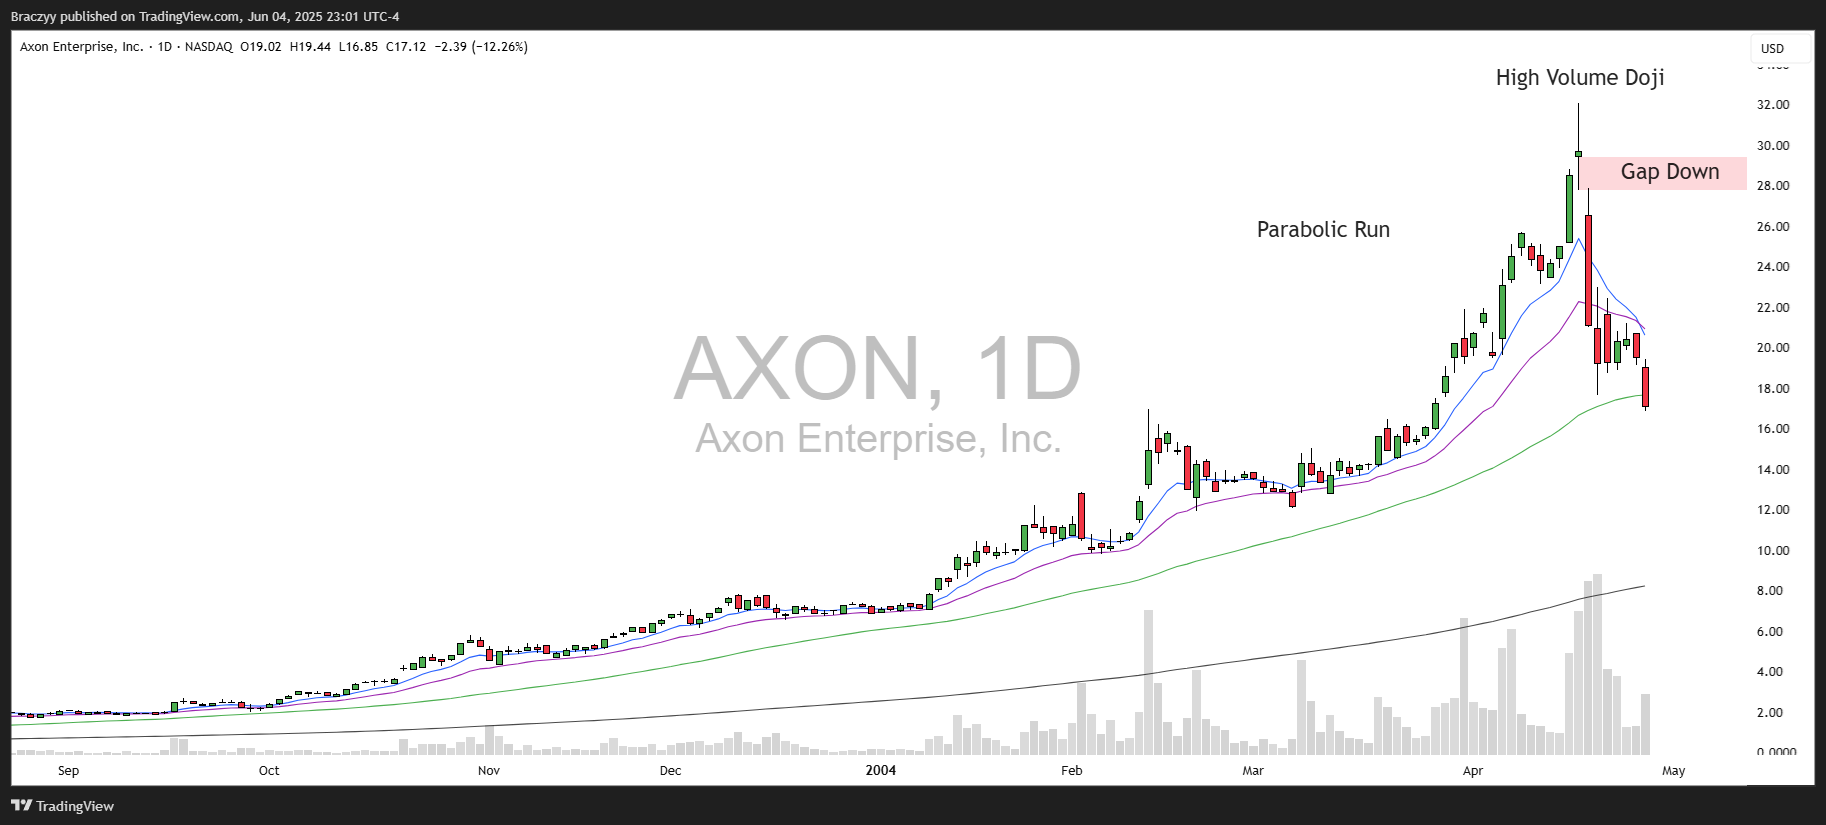
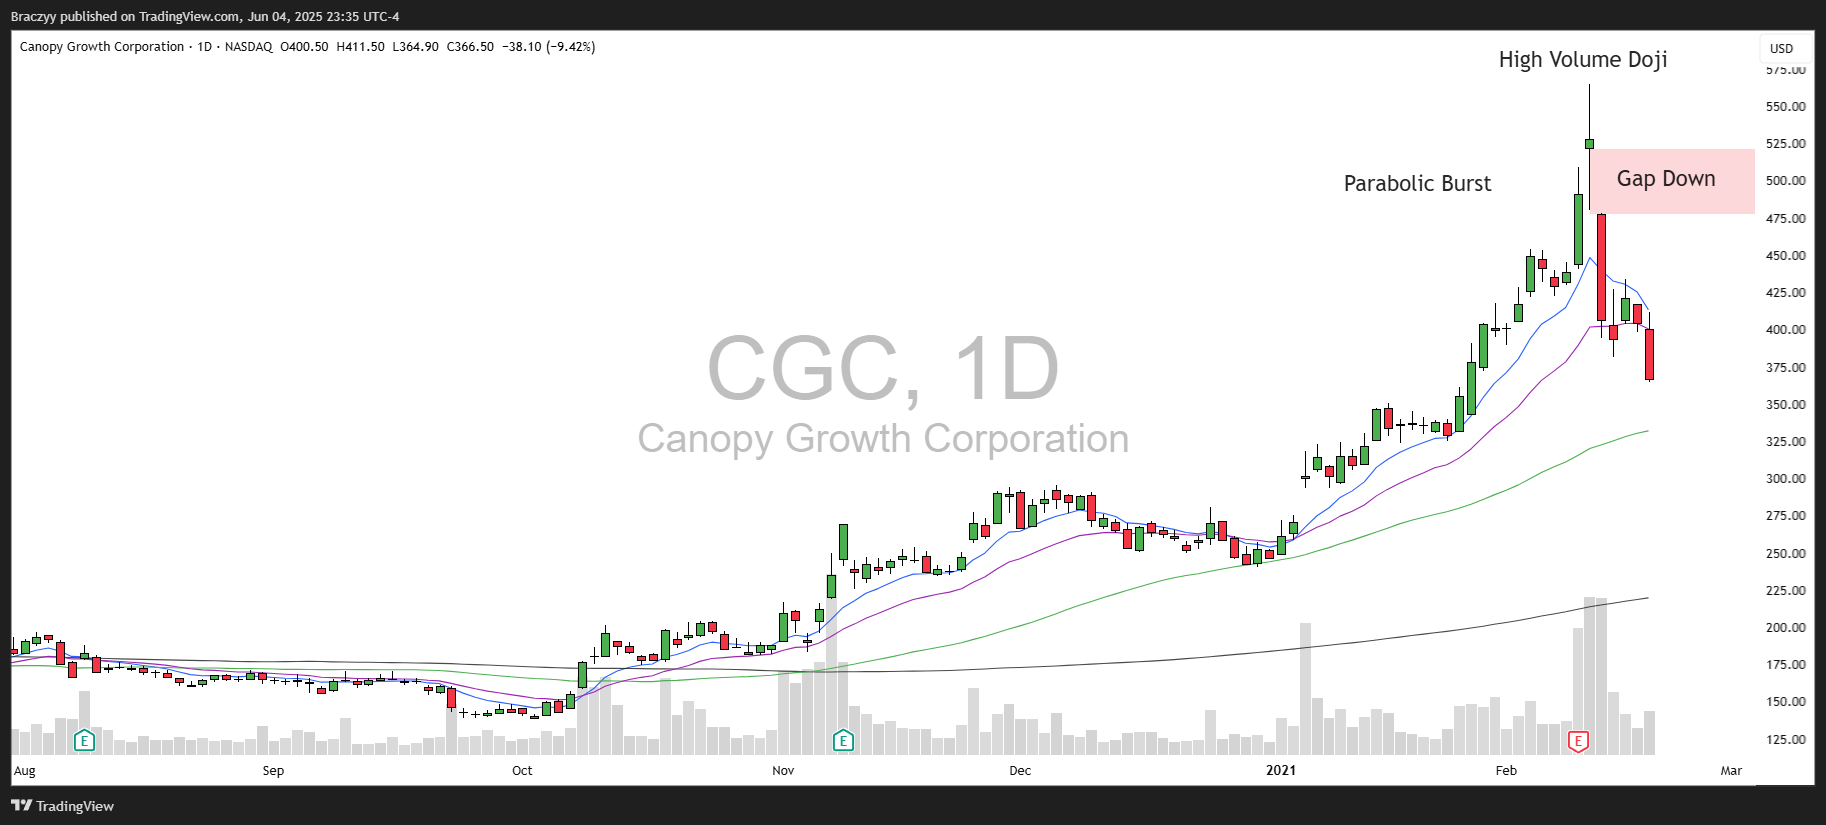
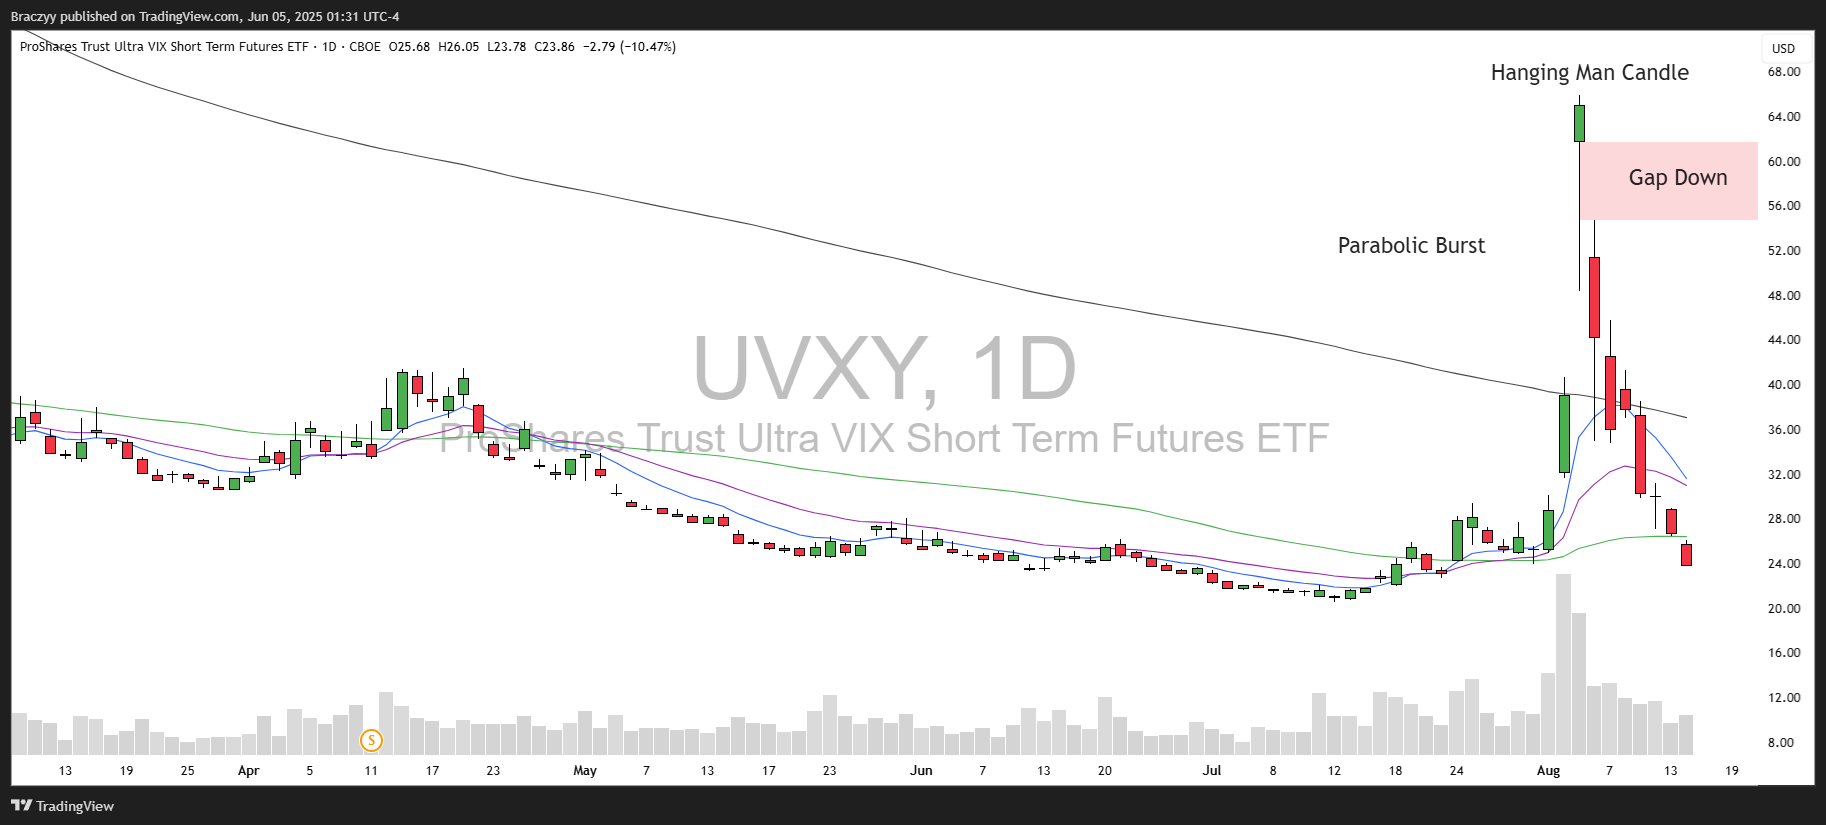
Another common parabolic topping pattern starts with the same sharp parabolic burst. However, on the climax day, instead of gapping up and closing below the open (like an exhaustion gap), the stock experiences an intraday sell-off. Sellers lack the strength to push it lower, and it closes near the middle or high of the day’s range. Then the stock gaps down the next day, and that is usually the nail in the coffin. This puts in candlestick’s that are commonly known as the “hanging man” or “Doji” at the high. The gap down the following day is key, as longs from the previous close are underwater and short sellers take advantage. Usually any opening range breakdown and failure to fill the gap begins the backside of the move and can be traded back to the daily 9EMA. I do not typically engage in this setup for reasons stated above, but the backside of the move can still be captured using this setup.
This is not a variation I will dive any deeper into in this write-up, but here are a few examples below:
DJT (10/29/2024)
FUTU (10/7/2024)
TASR (Now AXON - 4/19/2004)
TSLA (2/4/2020)

CGC (2/10/2021)
UVXY (8/5/2024)
Extension Metrics
Below is a curated sample of past large-cap Parabolic Short setups, detailing their extension metrics from the close before the climax day, included to address frequent questions about whether certain stocks qualify as parabolic when they clearly fall short of the necessary behavior or territory. While no single extension metric is universally reliable, the table below serves as a valuable guide, presenting averages for each column, including extensions above my preferred daily moving averages and the ATR multiples above the 50-day moving average, an indicator inspired by @jfsrevg and @RealSimpleAriel on X.
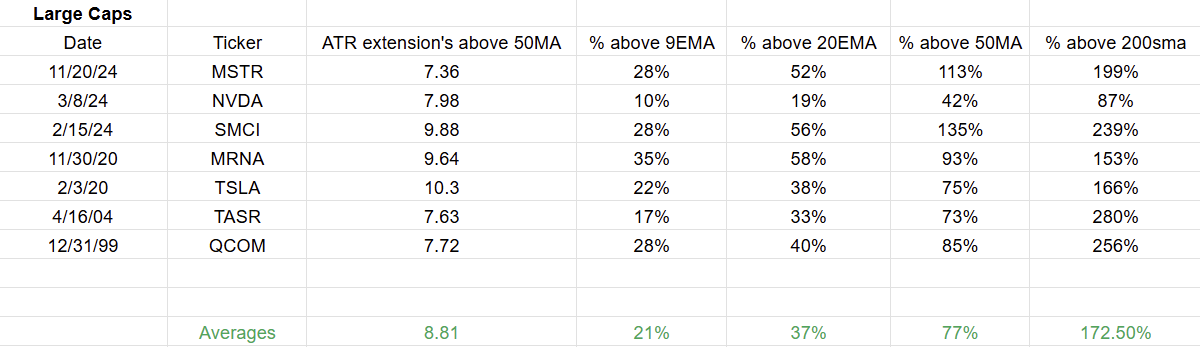
When assessing the Parabolic Short setup, a frequent mistake I notice among traders is relying solely on a stock’s percentage gain, overlooking its chart structure and formation. While basic metrics, like those mentioned above, can help flag a stock as “parabolic,” the true essence of a parabolic short lies beyond just the magnitude of the move. It’s also the steepness and intensity of that final parabolic leg—its slope and momentum—that truly define the opportunity.
“When it comes down to setups, always remind yourself that Structure and Behavioral reasons are equally important to specific parameters and numeric inputs.” - Marios Stamatoudis
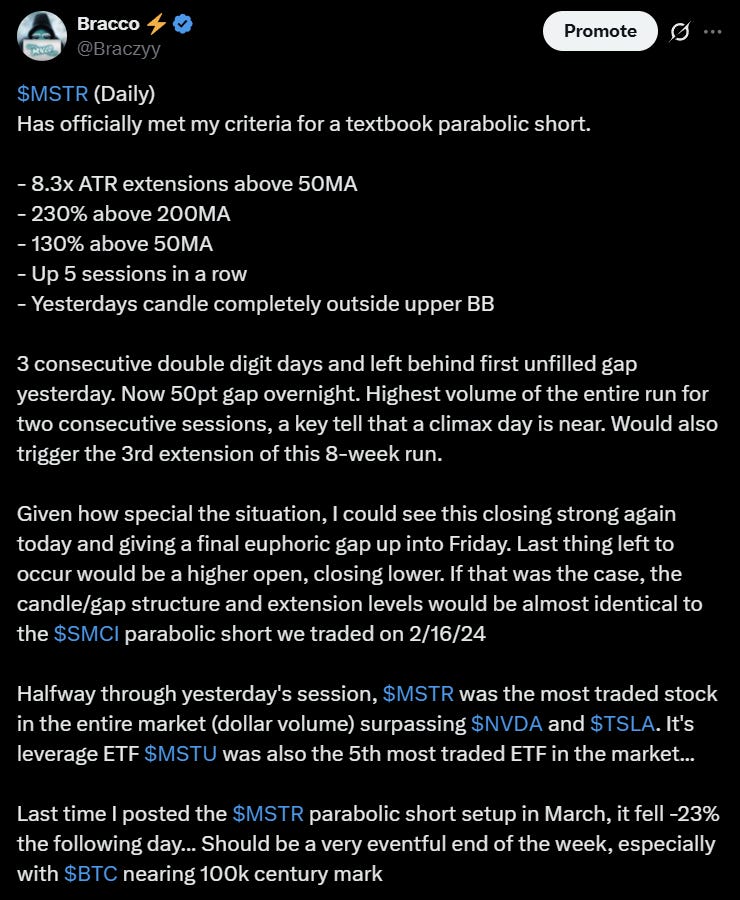
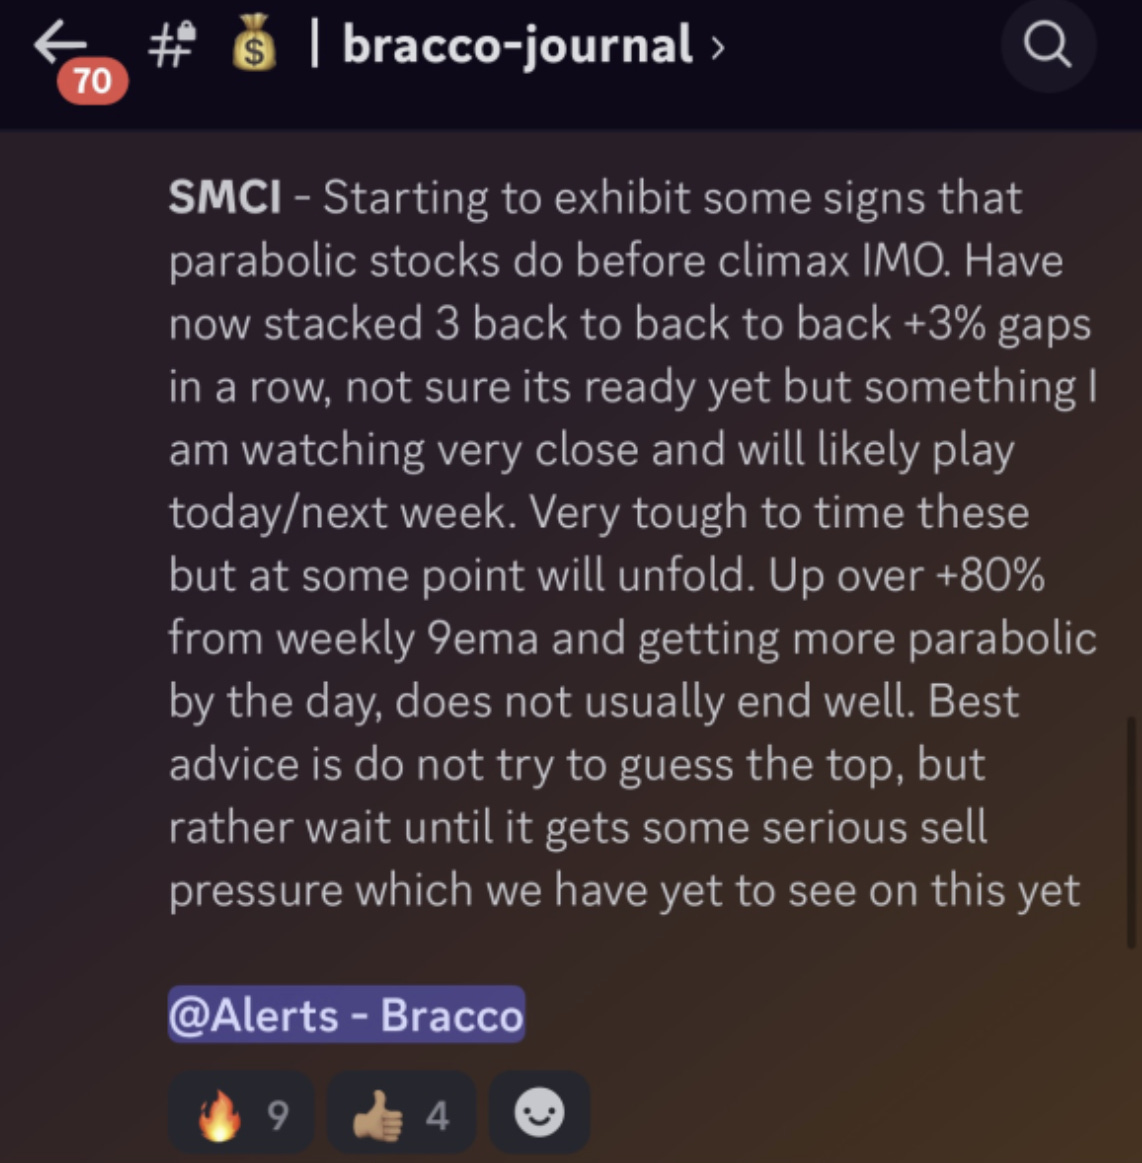
You don’t need to guess or get lucky when it comes to the parabolic short setup—there are countless historical examples to study. Markets don’t create new patterns; they recycle the same setups repeatedly. The models I shared earlier aren’t just for show—despite minor variations, they all reflect the same core pattern. To demonstrate that this setup isn’t just hindsight and can be accurately identified and timed, here are a couple examples of parabolic short ideas I shared on X or Discord the day before or the morning of the climax.

Conclusion & Key Takeaways
The parabolic short setup is a rare and thrilling opportunity for traders who can master its intricacies, but it requires precision, discipline, and patience. It’s not for the unprepared or those who waver under pressure. Entering too early or chasing poor setups can lead to significant losses. However, for those willing to put in the work—studying historical patterns, refining timing, and staying disciplined—the potential rewards are substantial. This setup is as much about mastering market psychology as it is about technical analysis, demanding that you block out noise, trust your process, and act decisively when the opportunity strikes. Study the charts, respect the risks, and wait patiently for those 5-star setups. These opportunities are rare, but when they appear, they offer a chance to profit from the market’s most predictable moments of chaos. Keep sharpening your skills, stay true to your strategy, and let the charts guide you to the next big trade.
- Bracco
Excellent write up. Thank you!
Wow! Great information in an easy to read format. Thanks!,