Let’s prepare for the week ahead! Hope you had a successful week in the market. We had some solid performance in the group from ideas posted here as well as new ideas that came in throughout the week. Every morning we host a Live Trading session in the discord starting at 9:15 EST. We go over the outlook for the session and run through our watchlist to find the top ideas for the day, zoom ends around 2PM EST most days.
Want live commentary, alerts, access to Bracco & TSDR, and a strong community of of 400+ committed traders? Join the Uncharted Territory Discord using promo code “SUBSTACK” !
Welcome to to all new subscribers. 1000 in the first week, thank you with great appreciation from Bracco and TSDR!
-Schedule for the week of economic data and earnings
-Market Breadth Data and Internals
-Index and ETF Analysis
-Bracco’s Breakdown and Top Ideas
-TSDR Weekly Outlooks and Watchlist
-Closing Comments and Mindset
Earnings & Economic Calendar for the Week
Market is closed on Thursday June 19th but open on Friday. So it is kind of a weird split week with a day off in the middle. The Q1 slate of earnings is coming to an end with almost all companies already reporting. Only one from this list that I am watching is APPS on Monday after market close.
Jerome Powell speaks at 2:30 PM EST on Wednesday for the June FOMC meeting and rate decision. And before that, on Tuesday we have Retail Sales data 1 hour before market open. Not much in terms of notable market data compared to last week besides the Honorable Jerome Powell and his purple tie mid week.
Market Breadth Data
StockBee (Pradeep Bonde) Market Monitor
Bracco’s Market Health Tracker
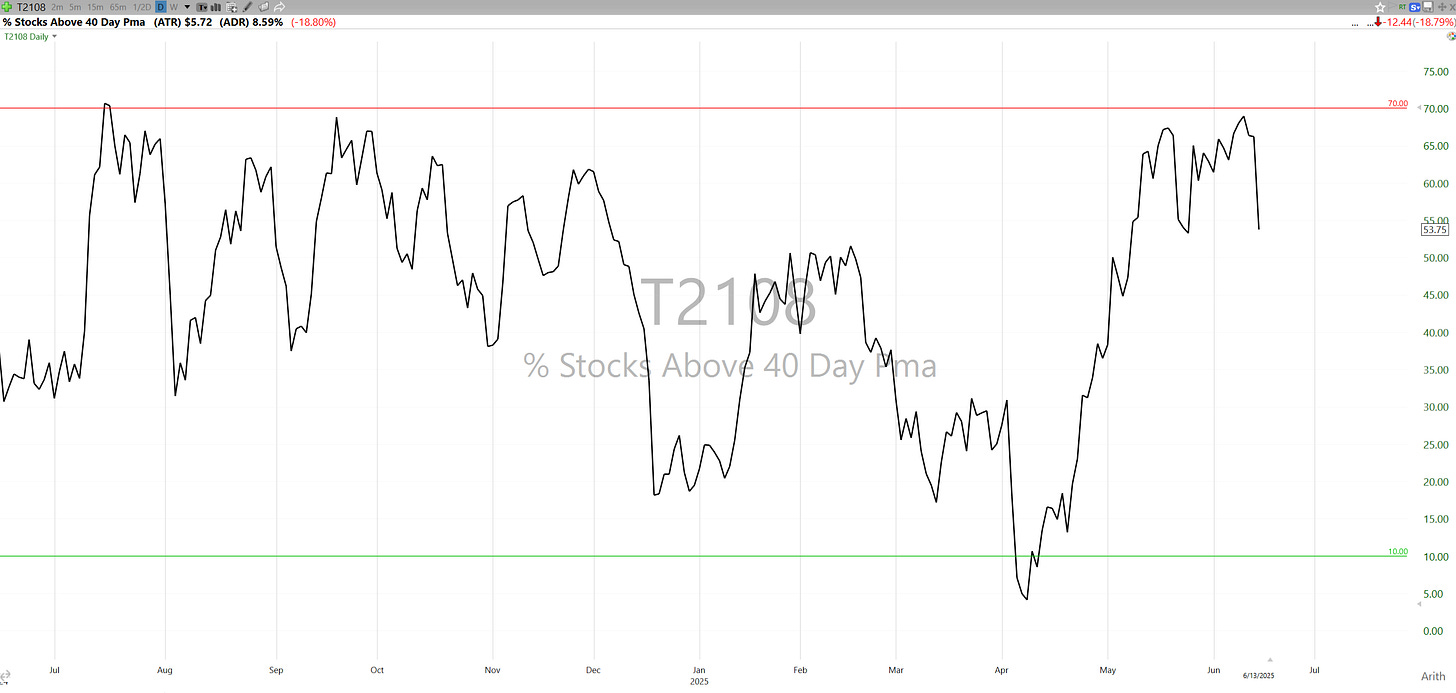
T2108 (% Stocks Above 40MA) = 53.75%
T2107 (% Stocks Above 200MA) = 33.99%
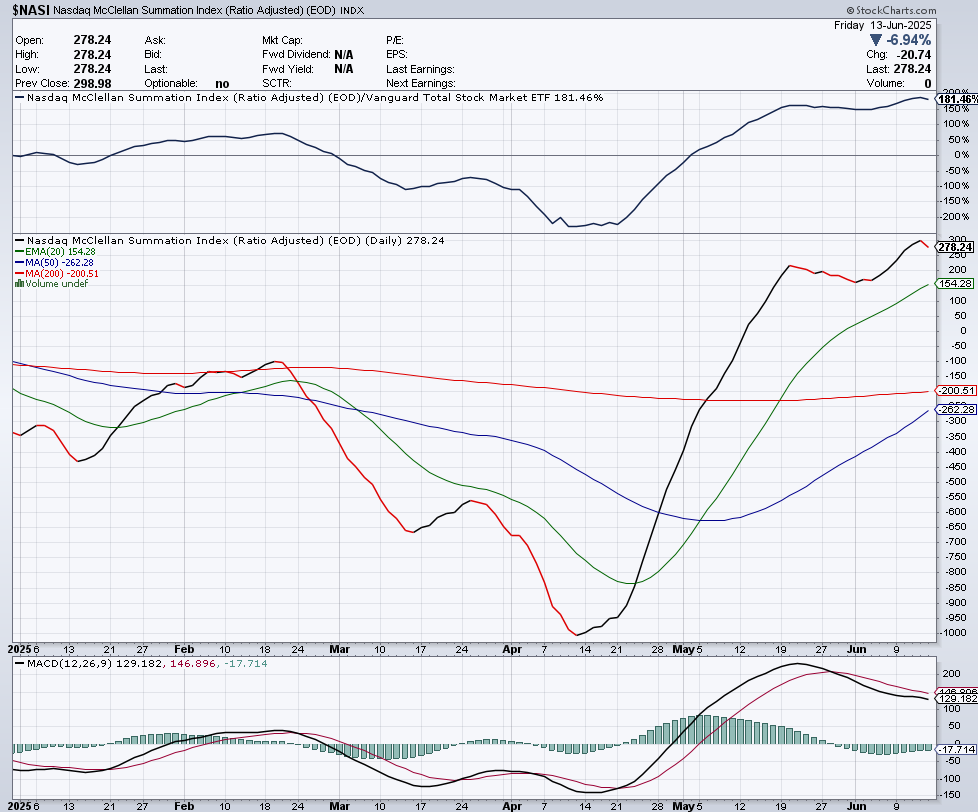
NASI
Index & ETF action, hourly levels, and insights for the week ahead
QQQ (Daily Chart)
Early week saw continued strength that resulted in a downside reversal candle on Wednesday, gapping up to open and closing red on the day. Thursday was a decent recovery closing as an inside day (entire candle within previous candle). Friday ended the week at lows after gapping down and attempting to rally in the morning. First daily close below the 9ema since 5/27 and only the third daily close below the 9ema since 4/22. We haven’t touched the 20ema since 4/30 and we are nearly 8% above the 50sma.
Expectation is a pull to the 20ema and gauge the reaction from there, that would be completely normal. The reaction at that spot over a couple days will be telling. Continue to keep an open mind about better than expected outcomes while balancing near term opportunities in individual names.
QQQ (Hourly Chart)
Trading level to level in an orderly fashion. $533 was reclaimed and then quickly failed. $523 and $520.80 are important. Failure to hold this area brings $516 as the expected spot to trade towards. Could see as low as $512 and $507 if conditions worsen. Ideally would like to see $520.80 see some buyers and get a buy signal in that area.
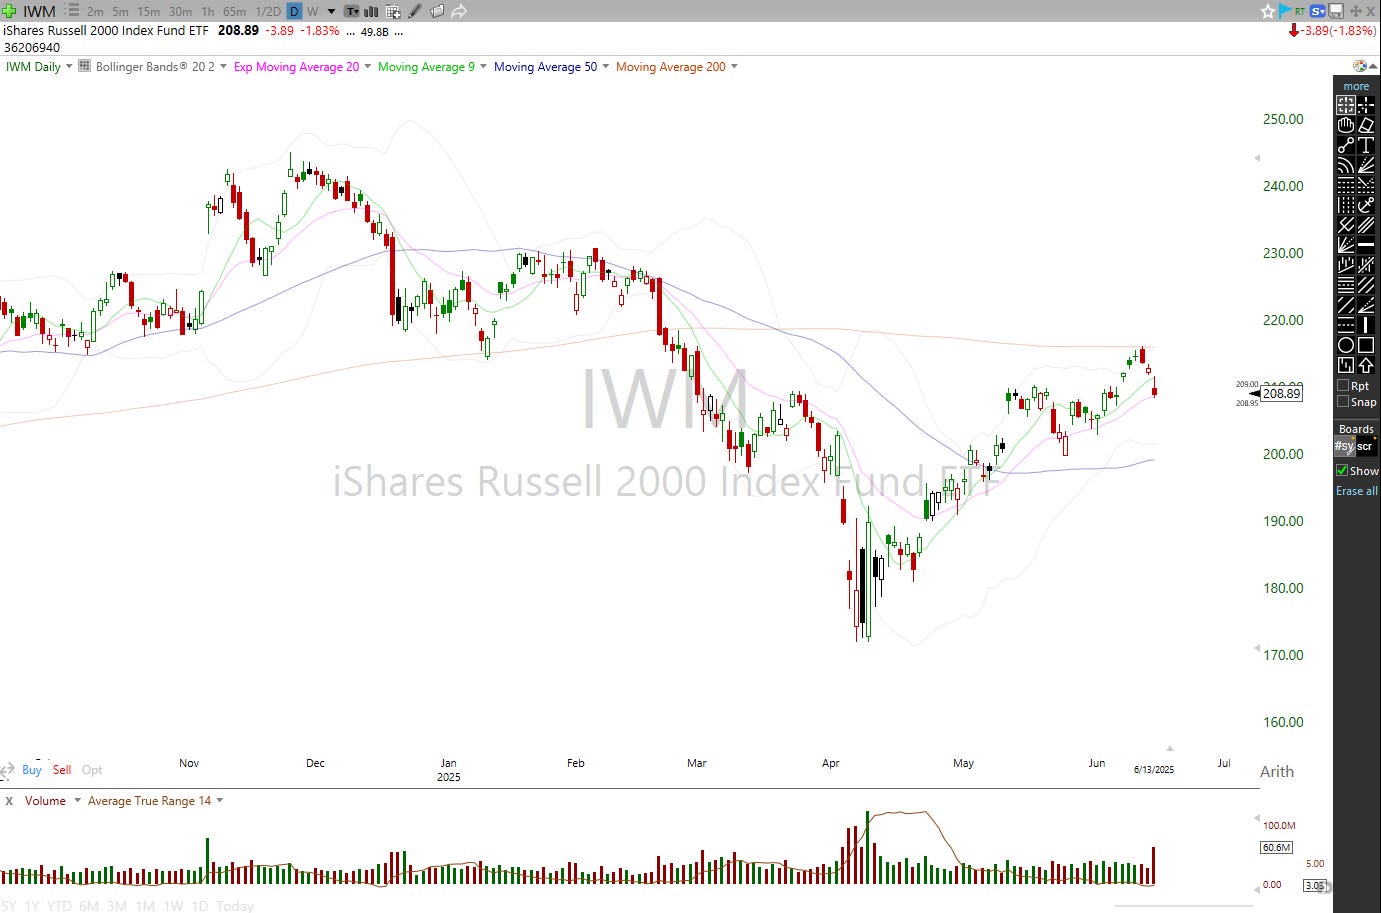
IWM (Daily Chart)
ARKK (Daily Chart)
Remains strong and closed green by 0.27% on Friday while QQQ was down 1.26% holding the 9ema. I continue to expect that open bullish gap from last Friday to remain open and a gauge of risk/growth stock behavior. Friday was a reasonable day to engage around $61 and LOD stop if you were looking to buy the gap down. Tightening here would make this and the ARKK holdings a top opportunity.
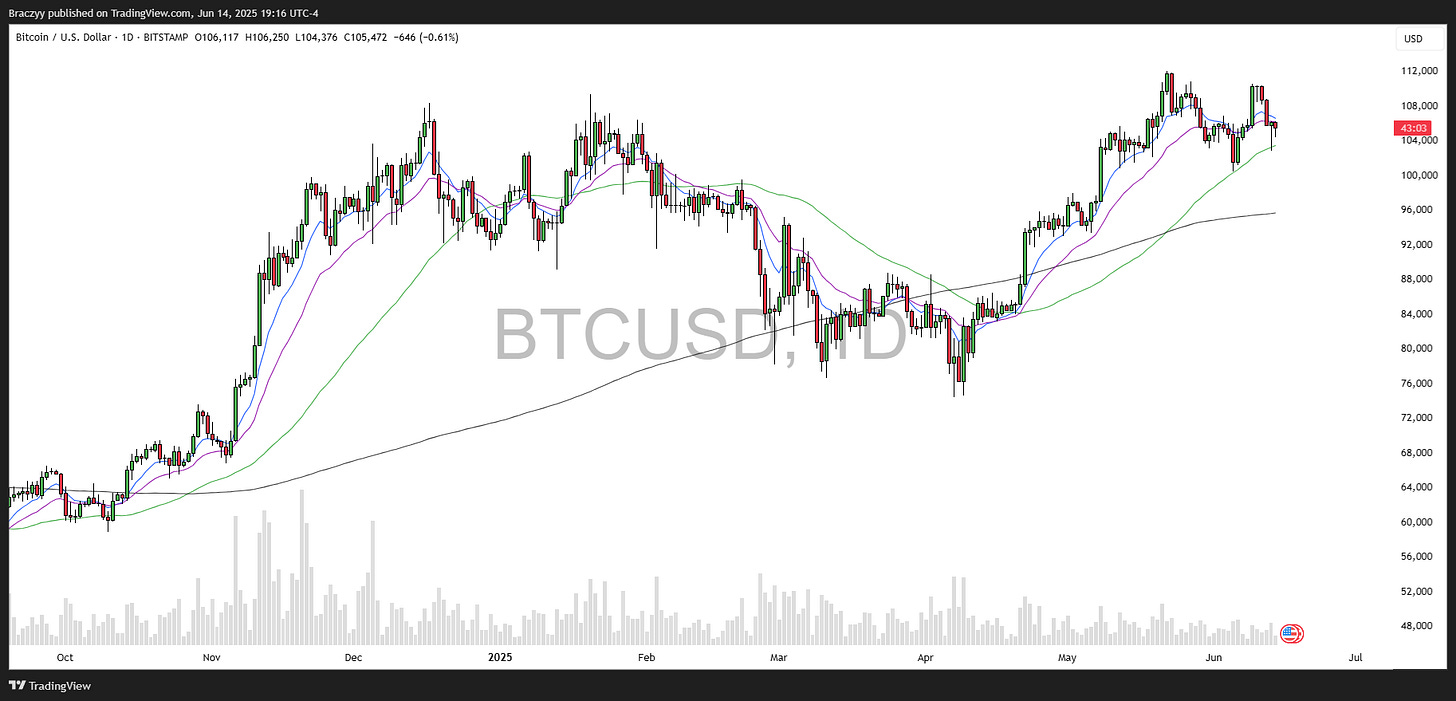
BTC (Daily Chart)
Bracco’s Breakdown & Top Ideas
As noted in last week's Sunday Scans newsletter, I'm heading out for a much needed vacation this week. With preparations in full swing, my focus will shift away from the markets temporarily. Last week was pretty slow for me, initiating just one new long position on Monday, which stopped me out the same day. Over the following days, I reduced exposure and stacked cash in response to a few warnings signals in the market. See below my activity Tuesday-Friday.
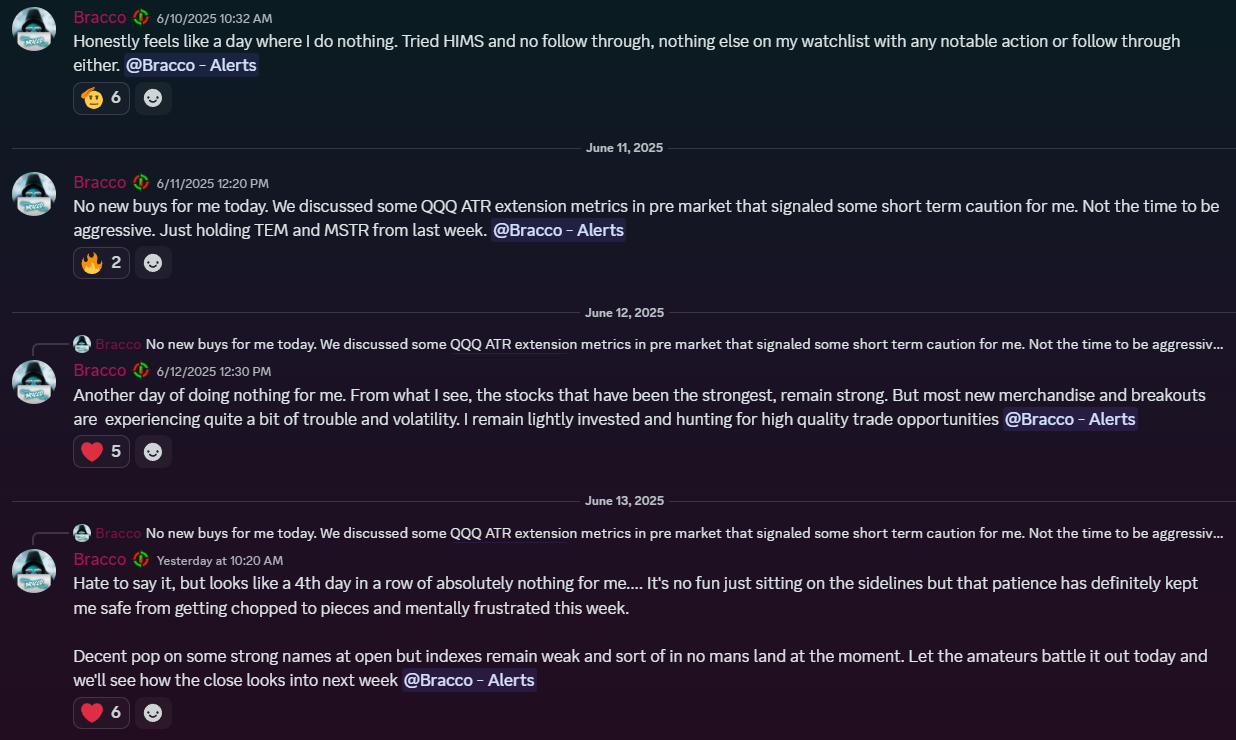
The Nasdaq's ATR (Average True Range) multiple, measured against its 50-day moving average, has proven to be one of my most reliable indicators for anticipating short-term pullbacks. I discussed live on zoom during Wednesday's pre-market session how this metric had hit a 7x extension. Historical data, as illustrated in the chart below, shows that whenever the Nasdaq reaches a 7x ATR extension above its 50-day moving average, a pullback of at least three days has consistently followed. While the depth of the pullback remains unknown, this signal was enough for me to take a more cautious approach and hold off on any new positions. For TC2000 users I have provided the formula for this indicator below the chart. I plot it as a histogram and use a 20-day ATR.
Compounding this signal, last week saw a notable lack of sustained momentum in new breakouts, with many failing to gain any traction for consecutive days. This weakness can be seen in the T2108 chart, which shows a sharp pullback from Tuesday’s highs. Together, these indicators suggest the market may need some time to reset.
I will be back from Vacation in the first week of July. I plan to be lightly active while I am gone, hopefully sharing some thoughts and insights in the discord and newsletter. I’ll be back, refreshed and ready to dive back into the action!
TSDR’s Weekly Outlook & Watchlist
I am 40% cash in my account with the remainder in my biggest winners over the past few weeks. I do like to hold for 3-4-5 weeks on winners but also appreciate the power of compounding and turnover into emerging stocks. I often hold 6-12 days then try to keep my account moving into new winners one-by-one as they work in my favor and stick around. Losers are cut quickly if they do not see a profit by close. I will often cut for -2% or less or if a stock breaks LOD (low of day) on the day of entry. I had a few things stick around like SHOP that cut for breakeven the next day after failing to advance. I’d rather be cash or in a moving stock than married to a stock that is not acting the way I expect it to.
Expected this rest and hope that it resets a bit of sentiment and the charts. Posted this tweet early in the week after triggers from watchlist saw minimal traction and some slow down appeared in the best setups.
NOW! Let’s get into some good stuff!
Holding: NBIS TSSI CRDO TEM LMND HOOD CRCL (If I didn’t have these, I would be posting them as trade ideas this week below)
These are all significantly in profit, aside from CRDO (+4.6%). Would love to still be in some “leaders” but over the past 3-4 weeks excluding maybe the last 7 sessions it has paid more to be in higher beta movers than the NFLX SPOT PLTRs of the world. Eh maybe PLTR should be in my account, but it has been sideways for 20 sessions now so I’d rather be in momentum burst winners.
Charts Covered - CRCL SLV EAT SNDK VLO SAIL AMTM ALAB TSLA
CRCL (Hourly)
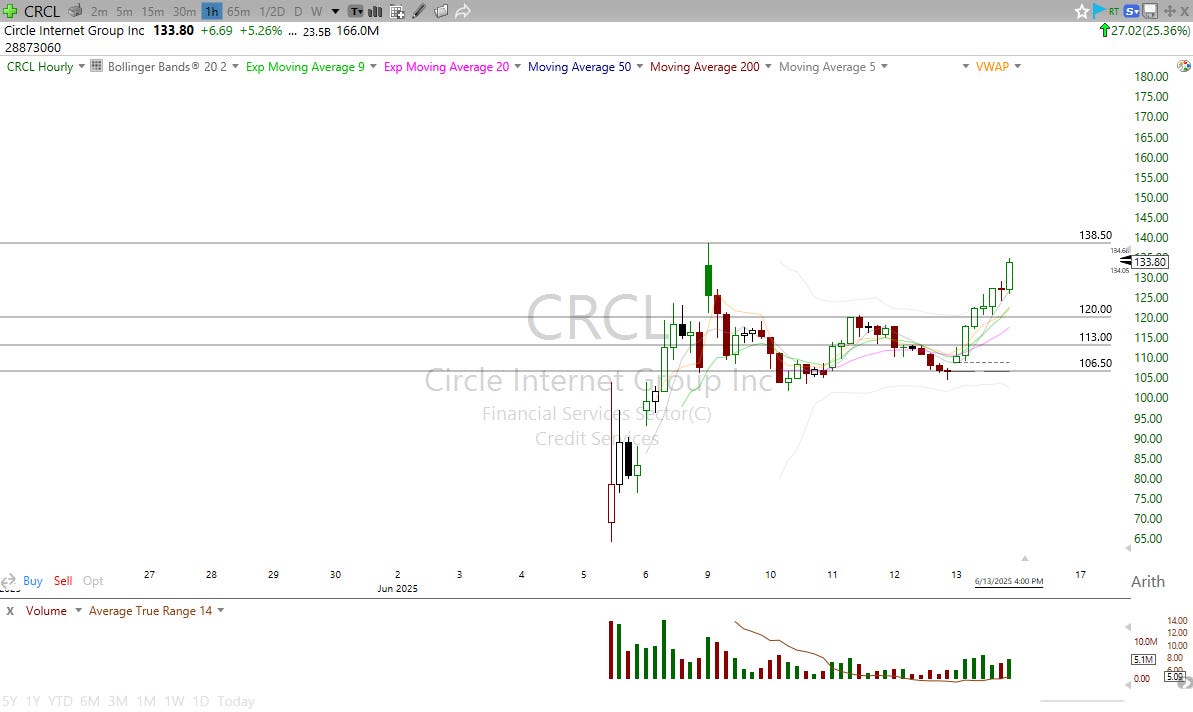
If not in already, would want to see an hourly handle or flag form here under IPO highs. The opening range break on Friday and taking out $120 sent this significantly higher. Any tightness and this should be a top priority.
Posted chart and flow on X as well
All of this came in on Friday, all bullish options flow. Put sellers and Call buyers. Notable imo and resembles CRWV flow.
Shoutout to the Options Flow Team at Uncharted Territory
-@AlexJonesIndustrialAverage
-@Manrav
-@AtTheAsk
SLV (Daily)
Digesting the massive breakout extremely well. Building out it’s first flag since. Looking for this to tighten slightly more and then actionable via SLV Calls for Jan2026 or AGQ (2X Silver).
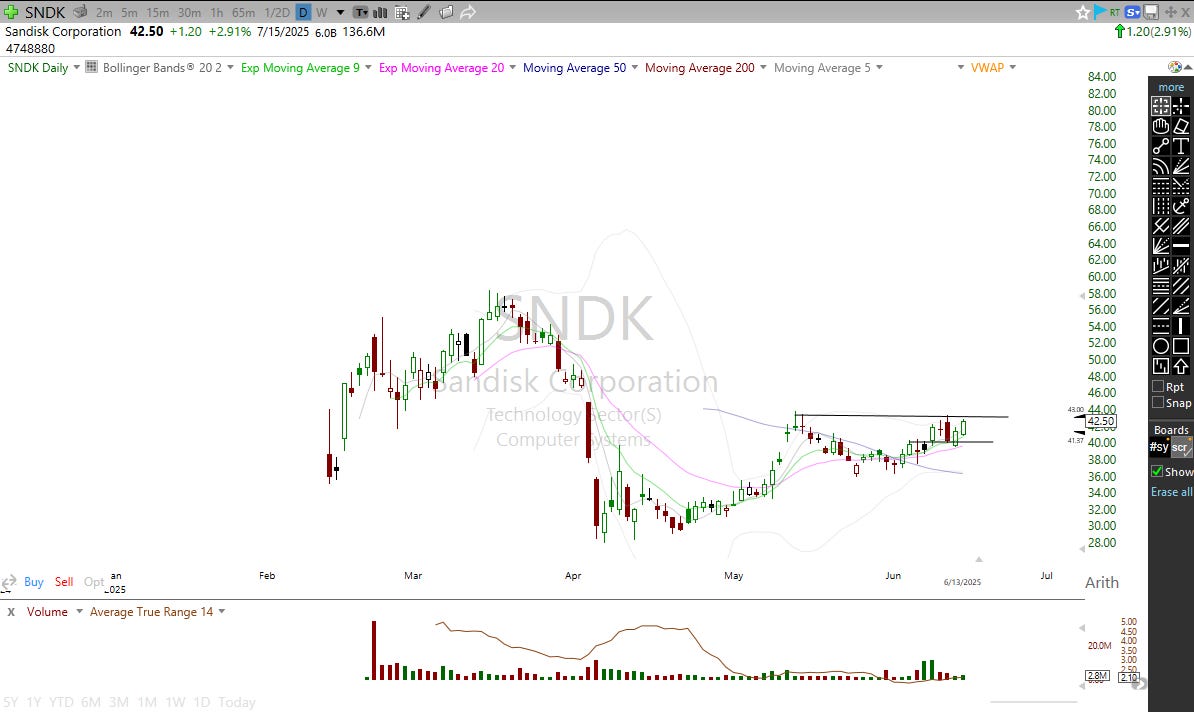
SNDK (Daily)
Still in play from last week’s idea. Gained momentum on Monday over $40 and now building out a true breakout over $43.25. Thursday’s low, daily 20ema, and $39.4 invalidation spot now.
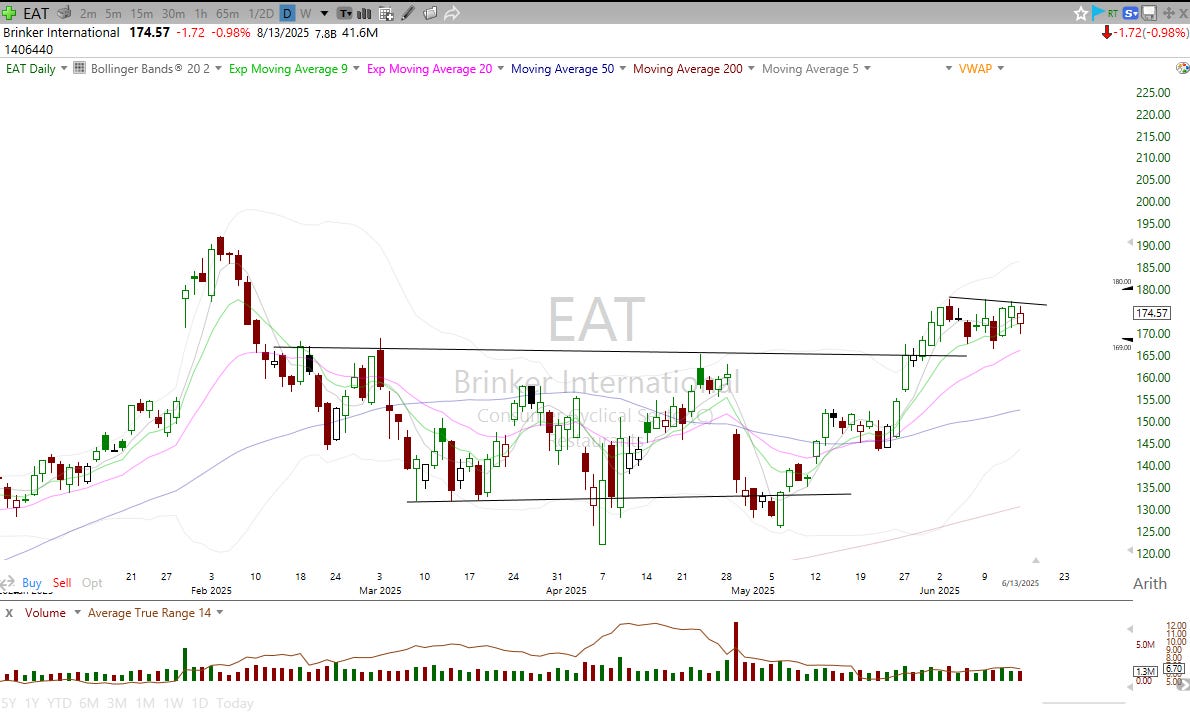
EAT (Daily)
Leading the restaurant stocks and has a clean flat pivot over $178
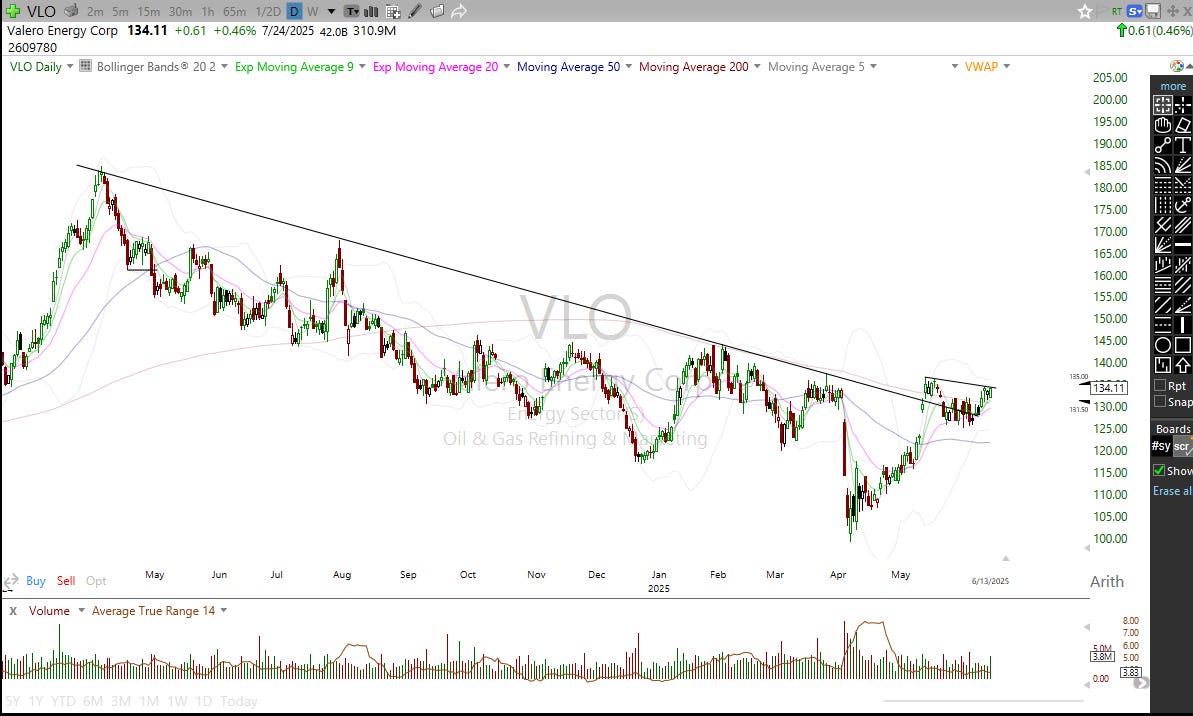
VLO (Daily)
Not the best at trading Oil Stocks, but this has a nice look as long as $130 holds.
SAIL (Daily)
Recent IPO in cybersecurity. Earnings breakout and double inside days. Looking for holds of $22 or over $23.50

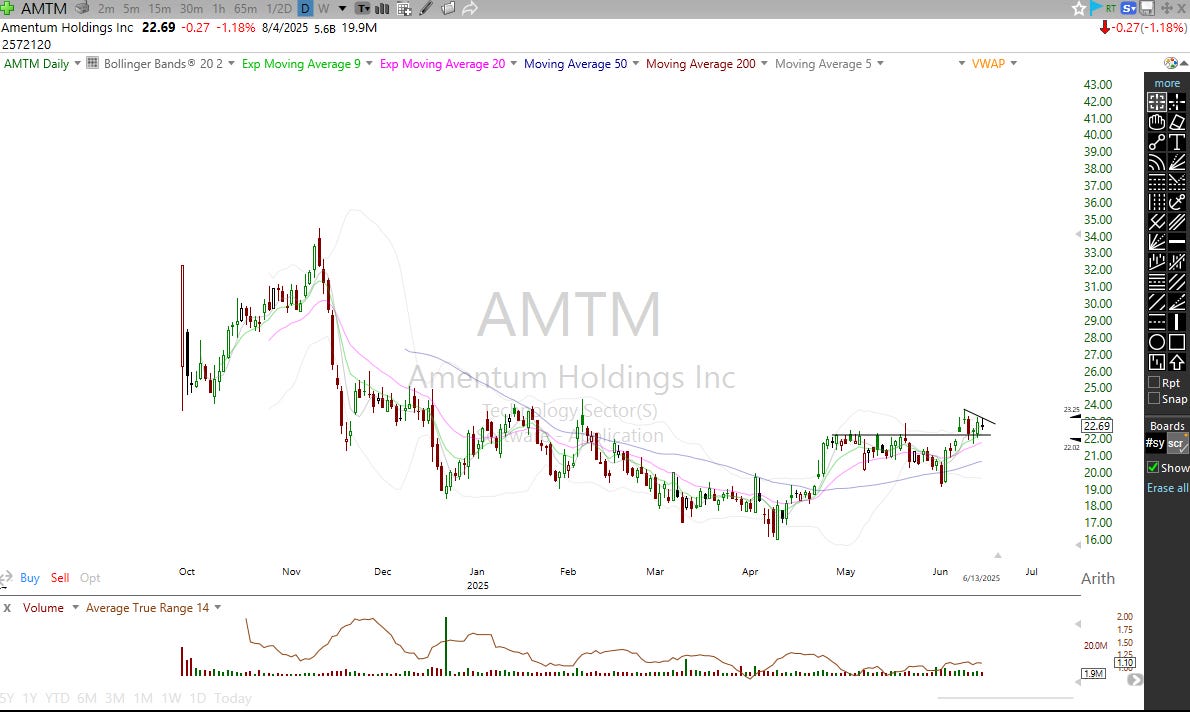
AMTM (Daily)
Inside day Friday, IPO base. Waiting for volume to pick up or a notable breakout over $24 and $25.
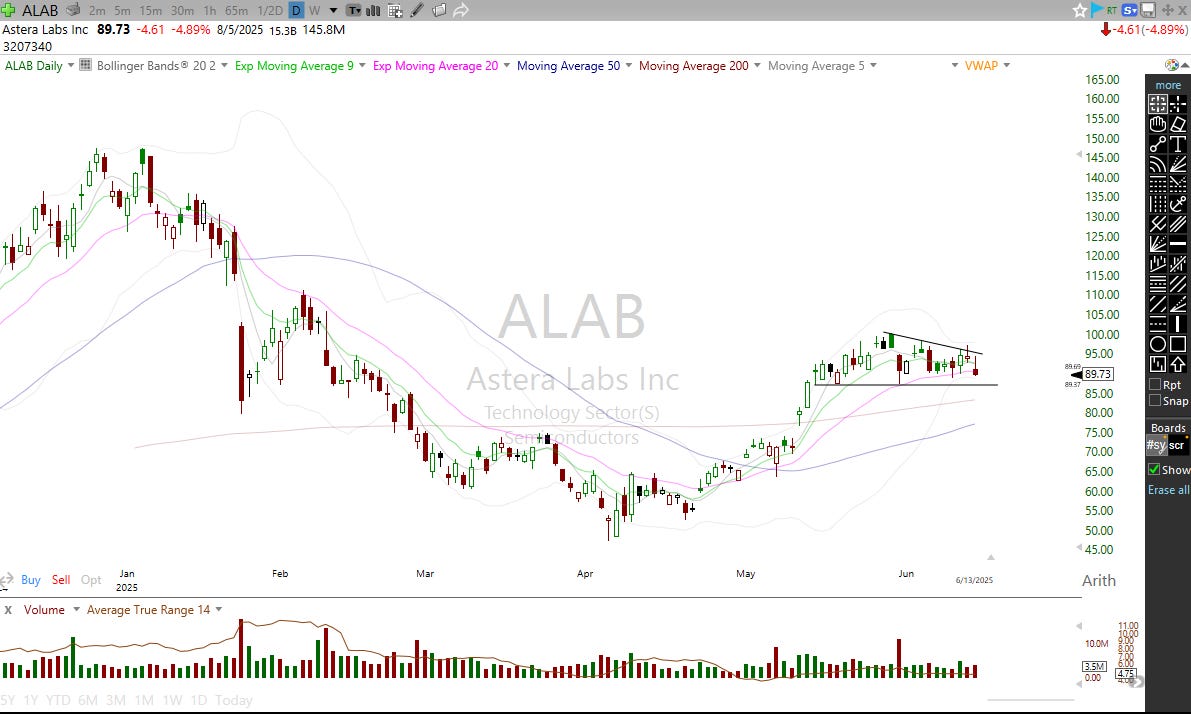
ALAB (Daily)
Tried last week off $90 as per last week’s post. Still tracking here, need a UnR (Undercut and Rally) under 20 ema here.
TSLA (Daily)
Tracking as Daily Trader for signs of mkt health. $325 a level above and $312-$314 below near term.
Broader list consists of leaders, themes, and relative strength-BYRN SOFI ALAB SMCI ETOR CLS LMND NBIS TSSI CRDO TEM MSTR COIN HSAI ASML VRT ERJ SAIL HIMS PCT LRCX ARM FUTU CORZ UBER CELH GEV LFMD PLTR NOW TLN ASTS GS JPM HOOD URBN PL DDOG SNOW DE PLNT CYBR BE STNE CRWV CRCL AMTM EAT TOST QBTS ACHR BBAI KLAC PANW GOOGL AMZN TSLA MU SLV CRWD VST ZS YPF VLO ZIM MPC GH CCJ DASH SPOT NXT FSLR UMAC SNDK UUUU DG PAAS APLD AVGO
I know this is a lot of stocks, but i actively scan through this list in premarket and throughout the day about 20-30 times. I set alerts on TC2000 at support levels and breakout levels. Some of these are actionable, some need more time. I suggest you look through this list and pick a few to pay attention to.
Closing Comments and Mindset
Overall, plan is it take it day by day. I am optimistic about the market but remain grounded in the fact that rest, or more, is very possible. Playing through one expectation at a time and reacting accordingly and right now that expectation is index 20ema pulls. From there, will analyze further the quality and length of the watchlist and try to build into trades one at a time and see what sticks. Knowing that if the market is healthy and we are watching quality stocks with relative strength in a top group or industry then we will find trades and exposure.
I am certainly mindful of the events in Israel and Iran and the effects on the oil markets, defense stocks, and sentiment. I have no nuanced opinions or insights on the matter nor do I have any predictions on the impact on the market other than what I can see in price. GeoPolitical events are hard to discount or price into the market. Generally, they are digested but also difficult due to the uncertain nature of the longevity and impact on markets. So i remain aware but lean on technicals and clearly a bit of “Tree Shaking” is occurring leading me to a more defensive approach until the market and my watchlist tell me to be more involved. See Bracco’s Breakdown and how the ATR extension as well as breakout traction foreshadowed this situation.
Bottom line is my watchlist gives me more signal than anything else and it has sent some warnings last week and the question stands is this a normal rest and building another wall of worry for the market to climb? Rather than guess or predict here it is important to lean on clues from the market and what is true. Recently, breakouts and traction has been limited and new setups have been prone to failure. When volatility increases it is best to observe and take note of stock behavior and clues of relative strength. And to be honest, it was hard to scan this weekend and find ideas. That tells me to stay patient. This could quickly change come Monday afternoon if stocks of interest give signs and areas to risk. I’d love for some of the stocks on my BROADER LIST to set up better.
I think there are certainly some standout charts that we noted and will discuss further in the discord throughout the week but will await the best opportunity to take action! Good luck this week and always be ready to be ready.


Excellent and detailed write-up!
Excellent info and analysis. Thank you and have a great, much-deserved, vacation!